National Grid 2012 Annual Report Download - page 47
Download and view the complete annual report
Please find page 47 of the 2012 National Grid annual report below. You can navigate through the pages in the report by either clicking on the pages listed below, or by using the keyword search tool below to find specific information within the annual report.-
 1
1 -
2
-
3
-
4
-
5
-
6
-
7
-
8
-
9
-
10
-
11
-
12
-
13
-
14
-
15
-
16
-
17
-
18
-
19
-
20
-
21
-
22
-
23
-
24
-
25
-
26
-
27
-
28
-
29
-
30
-
31
-
32
-
33
-
34
-
35
-
36
-
 37
37 -
 38
38 -
 39
39 -
 40
40 -
 41
41 -
 42
42 -
 43
43 -
 44
44 -
 45
45 -
 46
46 -
 47
47 -
 48
48 -
 49
49 -
 50
50 -
 51
51 -
 52
52 -
 53
53 -
 54
54 -
 55
55 -
 56
56 -
 57
57 -
58
-
59
-
60
-
61
-
62
-
63
-
64
-
65
-
66
-
67
-
68
 |
 |

46
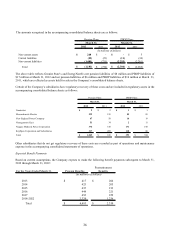
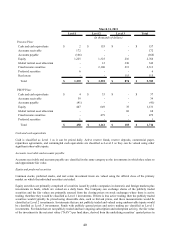
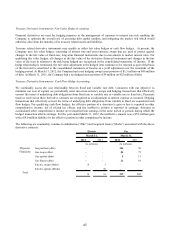
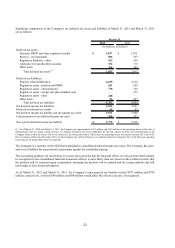
The following table presents the Company’ s derivative assets and liabilities that are included in the accompanying
consolidated balance sheets for the above contracts:
2012 2011 2012 2011
Current assets: Current liabilities:
Regulated contracts: Regulated contracts:
Gas swaps contracts 19$ 2$ Gas swaps contracts 59$ 33$
Gas futures contracts 1- Gas futures contracts 22 10
Gas options contracts 1- Gas options contracts 31
Gas purchase contracts 18 16 Gas purchase contracts 12 16
Electric swaps contracts 13 Electric swaps contracts 37 28
Electric options contracts -5 Electric options contracts --
Mark-to-market contracts: Mark-to-market contracts:
Gas swaps contracts -- Gas swaps contracts 11
Hedge contracts: Hedge contracts:
Fair value hedge contracts 1- Fair value hedge contracts 1-
Cash flow hedge contracts 11 - Cash flow hedge contracts --
52 26 135 89
Deferred assets: Deferred liabilities:
Regulated contracts: Regulated contracts:
Gas swaps contracts -1 Gas swaps contracts 72
Gas futures contracts -1 Gas futures contracts 61
Gas purchase contracts 40 38 Gas purchase contracts 19 25
Electric swaps contracts -3 Electric swaps contracts 31
Electric options contracts -96 Electric options contracts --
Hedge contracts: Hedge contracts:
Fair value hedge contracts 24 Fair value hedge contracts --
Cash flow hedge contracts -- Cash flow hedge contracts 22 -
42 143 57 29
Total 94$ 169$ Total 192$ 118$
Asset Derivatives Liability Derivatives
(in millions of dollars) (in millions of dollars)
March 31, March 31,
The change in fair value of the regulated contracts is offset by changes in regulatory assets and liabilities. As a result, the
changes in fair value of derivative contracts and their offsetting regulatory assets and liabilities had no impact on the
consolidated statement of income. The change in fair value of the mark-to-market contracts had an earnings impact, and
is included in other income in the accompanying consolidated statements of income.