Loreal 2011 Annual Report Download - page 90
Download and view the complete annual report
Please find page 90 of the 2011 Loreal annual report below. You can navigate through the pages in the report by either clicking on the pages listed below, or by using the keyword search tool below to find specific information within the annual report.-
 1
1 -
2
-
3
-
4
-
5
-
6
-
7
-
8
-
9
-
10
-
11
-
12
-
13
-
14
-
15
-
16
-
17
-
18
-
19
-
20
-
21
-
22
-
23
-
24
-
25
-
26
-
27
-
28
-
29
-
30
-
31
-
32
-
33
-
34
-
35
-
36
-
37
-
38
-
39
-
40
-
41
-
42
-
43
-
44
-
45
-
46
-
47
-
48
-
49
-
50
-
51
-
52
-
53
-
54
-
55
-
56
-
57
-
58
-
59
-
60
-
61
-
62
-
63
-
64
-
65
-
66
-
67
-
68
-
69
-
70
-
71
-
72
-
73
-
74
-
75
-
76
-
77
-
78
-
79
-
 80
80 -
 81
81 -
 82
82 -
 83
83 -
 84
84 -
 85
85 -
 86
86 -
 87
87 -
 88
88 -
 89
89 -
 90
90 -
 91
91 -
 92
92 -
 93
93 -
 94
94 -
 95
95 -
 96
96 -
 97
97 -
 98
98 -
 99
99 -
 100
100 -
101
-
102
-
103
-
104
-
105
-
106
-
107
-
108
-
109
-
110
-
111
-
112
-
113
-
114
-
115
-
116
-
117
-
118
-
119
-
120
-
121
-
122
-
123
-
124
-
125
-
126
-
127
-
128
-
129
-
130
-
131
-
132
-
133
-
134
-
135
-
136
-
137
-
138
-
139
-
140
-
141
-
142
-
143
-
144
-
145
-
146
-
147
-
148
-
149
-
150
-
151
-
152
-
153
-
154
-
155
-
156
-
157
-
158
-
159
-
160
-
161
-
162
-
163
-
164
-
165
-
166
-
167
-
168
-
169
-
170
-
171
-
172
-
173
-
174
-
175
-
176
-
177
-
178
-
179
-
180
-
181
-
182
-
183
-
184
-
185
-
186
-
187
-
188
-
189
-
190
-
191
-
192
-
193
-
194
-
195
-
196
-
197
-
198
-
199
-
200
-
201
-
202
-
203
-
204
-
205
-
206
-
207
-
208
-
209
-
210
-
211
-
212
-
213
-
214
-
215
-
216
-
217
-
218
-
219
-
220
-
221
-
222
-
223
-
224
-
225
-
226
-
227
-
228
-
229
-
230
-
231
-
232
-
233
-
234
-
235
-
236
-
237
-
238
-
239
-
240
-
241
-
242
-
243
-
244
-
245
-
246
 |
 |

88 REGISTRATION DOCUMENT − L’ORÉAL 2011
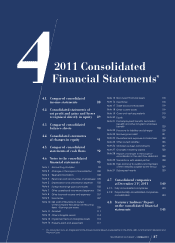
42011 Consolidated Financial Statements
Compared consolidated income statements
L’Oréalparent company is a French company with its registered offi ce in France, which performs a sales activity
specifi c to that country. At the same time, L’Oréal parent company has fi rstly a role of holding company and strategic
coordination and secondly that of scientifi c, industrial and marketing coordination of the L’Oréal Group on a
worldwide basis. Most of the subsidiaries have a role of marketing of the products manufactured by the Group’s
factories in the countries or zones in which it is established.
The L’Oréal Group wholly owns the vast majority of its subsidiaries. It also holds 50% of the share capital of Galderma
and Innéov developed in a joint venture with Nestlé.
The fi nancial statements set out in this chapter present the results of the L’Oréal Group as a whole, including all
subsidiaries . The Statutory Auditors’ Report on the consolidated fi nancial statements has been included at the end of
this chapter.
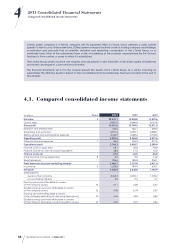
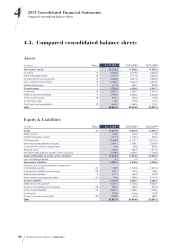
4.1. Compared consolidated income statements
€ millions
Notes 2011 2010 2009
Net sales 3 20,343.1 19,495.8 17,472.6
Cost of sales -5,851.5 -5,696.5 -5,161.6
Gross profit 14,491.6 13,799.3 12,311.0
Research and development -720.5 -664.7 -609.2
Advertising and promotion -6,291.6 -6,029.1 -5,388.7
Selling, general and administrative expenses -4,186.9 -4,048.6 -3,735.5
Operating profit 3,292.6 3,056.9 2,577.6
Other income and expenses 7 -96.3 -153.2 -277.6
Operational profit 3,196.3 2,903.7 2,299.9
Finance costs on gross debt -48.1 -43.8 -92.0
Finance income on cash and cash equivalents 28.5 17.2 16.0
Finance costs, net -19.6 -26.6 -76.0
Other financial income (expenses) 8 -5.6 -9.0 -13.0
Sanofi dividends 295.6 283.8 260.1
Profit before tax and non-controlling interests 3,466.7 3,151.9 2,471.0
Income tax 9 -1,025.8 -909.9 -676.1
Net profit 2,440.9 2,242.0 1,794.9
attributable to:
- owners of the c ompany 2,438.4 2,239.7 1,792.2
- non-controlling interests 2.5 2.3 2.7
Earnings per share attributable to owners
of the c ompany (euros) 10 4.11 3.82 3.07
Diluted earnings per share attributable to owners
of the c ompany (euros) 10 4.08 3.79 3.07
Earnings per share attributable to owners
of the c ompany excluding non-recurring items (euros) 10 4.36 4.04 3.42
Diluted earnings per share attributable to owners
of the c ompany excluding non-recurring items (euros) 10 4.32 4.01 3.42