Loreal 2011 Annual Report Download - page 125
Download and view the complete annual report
Please find page 125 of the 2011 Loreal annual report below. You can navigate through the pages in the report by either clicking on the pages listed below, or by using the keyword search tool below to find specific information within the annual report.-
 1
1 -
2
-
3
-
4
-
5
-
6
-
7
-
8
-
9
-
10
-
11
-
12
-
13
-
14
-
15
-
16
-
17
-
18
-
19
-
20
-
21
-
22
-
23
-
24
-
25
-
26
-
27
-
28
-
29
-
30
-
31
-
32
-
33
-
34
-
35
-
36
-
37
-
38
-
39
-
40
-
41
-
42
-
43
-
44
-
45
-
46
-
47
-
48
-
49
-
50
-
51
-
52
-
53
-
54
-
55
-
56
-
57
-
58
-
59
-
60
-
61
-
62
-
63
-
64
-
65
-
66
-
67
-
68
-
69
-
70
-
71
-
72
-
73
-
74
-
75
-
76
-
77
-
78
-
79
-
80
-
81
-
82
-
83
-
84
-
85
-
86
-
87
-
88
-
89
-
90
-
91
-
92
-
93
-
94
-
95
-
96
-
97
-
98
-
99
-
100
-
101
-
102
-
103
-
104
-
105
-
106
-
107
-
108
-
109
-
110
-
111
-
112
-
113
-
114
-
 115
115 -
 116
116 -
 117
117 -
 118
118 -
 119
119 -
 120
120 -
 121
121 -
 122
122 -
 123
123 -
 124
124 -
 125
125 -
 126
126 -
 127
127 -
 128
128 -
 129
129 -
 130
130 -
 131
131 -
 132
132 -
 133
133 -
 134
134 -
 135
135 -
136
-
137
-
138
-
139
-
140
-
141
-
142
-
143
-
144
-
145
-
146
-
147
-
148
-
149
-
150
-
151
-
152
-
153
-
154
-
155
-
156
-
157
-
158
-
159
-
160
-
161
-
162
-
163
-
164
-
165
-
166
-
167
-
168
-
169
-
170
-
171
-
172
-
173
-
174
-
175
-
176
-
177
-
178
-
179
-
180
-
181
-
182
-
183
-
184
-
185
-
186
-
187
-
188
-
189
-
190
-
191
-
192
-
193
-
194
-
195
-
196
-
197
-
198
-
199
-
200
-
201
-
202
-
203
-
204
-
205
-
206
-
207
-
208
-
209
-
210
-
211
-
212
-
213
-
214
-
215
-
216
-
217
-
218
-
219
-
220
-
221
-
222
-
223
-
224
-
225
-
226
-
227
-
228
-
229
-
230
-
231
-
232
-
233
-
234
-
235
-
236
-
237
-
238
-
239
-
240
-
241
-
242
-
243
-
244
-
245
-
246
 |
 |

123REGISTRATION DOCUMENT − L’ORÉAL 2011
2011 Consolidated Financial Statements
4
Notes to the consolidated nancial statements
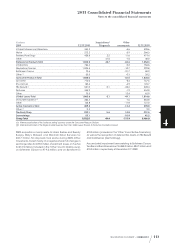
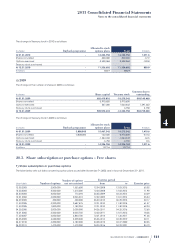
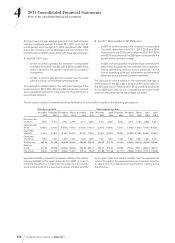
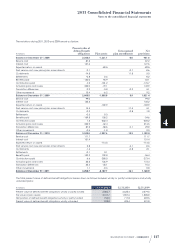
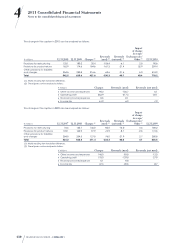
Data concerning all share option plans during fiscal years 2009, 2010 and 2011 are set out below:
12.31.2011 12.31.2010 12.31.2009
Number of
options
Weighted
average
exercise
price
Number of
options
Weighted
average
exercise
price
Number of
options
Weighted
average
exercise
price
Number of options not exercised at beginning
of period 37,296,504 71.55 40,051,000 70.86 39,166,092 72.39
♦Options granted 1,470,000 83.19 4,200,000 80.03 3,650,000 50.11
♦Options exercised -4,730,120 70.24 -4,920,243 68.40 -1,591,442 59.87
♦Options expired -1,511,952 -2,034,253 -1,173,650
Number of options not exercised at end of period 32,524,432 72.02 37,296,504 71.55 40,051,000 70.86
Of which:
number of exercisable options at end of period 19,450,832 69.63 18,299,654 67.61 19,083,150 71.32
expired options at end of period 214,750 326,750 571,000
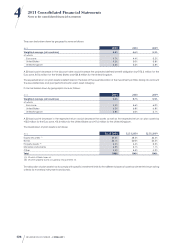
The weighted average share price was €81.60million, €80.47million and €60.37million, respectively, for2011, 2010 and2009.
The total charge recorded in2011, 2010 and2009 amounted to €62.8million, €76.5million and €74.5million, respectively.
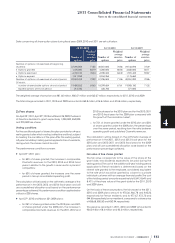
2) Free shares
On April22nd, 2011, April27th, 2010 and March25, 2009, the Board
of Directors decided to grant respectively 1,038,000, 450,000
and 270,000free shares.
Vesting conditions
For the conditional grant of shares, the plan provides for a 4-year
vesting period after which vesting is effective and final, subject
to meeting the conditions of the plan. After this vesting period,
a 2-year mandatory holding period applies for French residents,
during which the shares cannot be sold.
The performance conditions concern:
♦April22nd, 2011 plan:
− for 50% of shares granted, the increase in comparable
Cosmetic revenues for the 2012, 2013 and 2014 fiscal
years in relation to the growth in revenues for a panel of
competitors;
− for 50% of shares granted, the increase over the same
period in Group consolidated operating profit.
The calculation will be based on the arithmetic average of the
performance in the 2012, 2013 and 2014 fiscal years and will
use a predefined allocation scal based on the performance
percentage achieved. No performance condition applies below
a block of 200shares.
♦April27th, 2010 and March25th, 2009 plans:
− for 25% of shares granted under the 2010 plan and 50%
of shares granted under the 2009 plan, the increase in
comparable Cosmetic revenues for the 2011, 2012 and
2013 fiscal years for the 2010 plan and for the 2010, 2011
and 2012 fiscal years for the 2009 plan compared with
the growth of the cosmetics market;
− for 75% of shares granted under the 2010 plan and 50%
of shares granted under the 2009 plan, the percentage,
over the same period, resulting from the ratio between
operating profit and published Cosmetic revenues.
The calculation will be based on the arithmetic average of
performance in the 2011, 2012 and 2013 fiscal years for the
2010 plan and 2010, 2011 and 2012 fiscal years for the 2009
plan, and will use a predefined allocation scale based on the
performance percentage achieved.
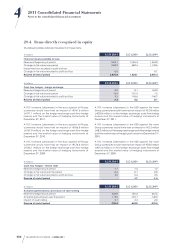
Fair value of free shares granted
The fair value corresponds to the value of the share at the
grant date, less dividends expected to be paid during the
vesting period. The cost of the additional 2-year holding period
applicable to French residents is determined based on the
interest rate granted to the employee, considered equivalent
to the rate which would be granted by a bank to a private
individual customer with an average financial profile. The cost
of the holding period amounts respectively to 8.54%, 8.64% and
8.47% of the share value at the grant date for the 2011, 2010
and 2009 plans.
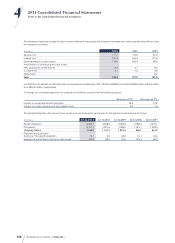
On the basis of these assumptions, the fair values for the 2011,
2010 and 2009 plans amount to €70.36, €66.78 and €40.23
respectively for French residents, and to €77.67, €73.73 and
€44.55 respectively, for non-residents, compared to a share price
of €85.68, €80.50 and €50.94, respectively.
The expense recorded in2011, 2010 and 2009 amounted to
€24.0million, €8.4million and €2.2million, respectively.