Loreal 2011 Annual Report Download - page 81
Download and view the complete annual report
Please find page 81 of the 2011 Loreal annual report below. You can navigate through the pages in the report by either clicking on the pages listed below, or by using the keyword search tool below to find specific information within the annual report.-
 1
1 -
2
-
3
-
4
-
5
-
6
-
7
-
8
-
9
-
10
-
11
-
12
-
13
-
14
-
15
-
16
-
17
-
18
-
19
-
20
-
21
-
22
-
23
-
24
-
25
-
26
-
27
-
28
-
29
-
30
-
31
-
32
-
33
-
34
-
35
-
36
-
37
-
38
-
39
-
40
-
41
-
42
-
43
-
44
-
45
-
46
-
47
-
48
-
49
-
50
-
51
-
52
-
53
-
54
-
55
-
56
-
57
-
58
-
59
-
60
-
61
-
62
-
63
-
64
-
65
-
66
-
67
-
68
-
69
-
70
-
 71
71 -
 72
72 -
 73
73 -
 74
74 -
 75
75 -
 76
76 -
 77
77 -
 78
78 -
 79
79 -
 80
80 -
 81
81 -
 82
82 -
 83
83 -
 84
84 -
 85
85 -
 86
86 -
 87
87 -
 88
88 -
 89
89 -
 90
90 -
 91
91 -
92
-
93
-
94
-
95
-
96
-
97
-
98
-
99
-
100
-
101
-
102
-
103
-
104
-
105
-
106
-
107
-
108
-
109
-
110
-
111
-
112
-
113
-
114
-
115
-
116
-
117
-
118
-
119
-
120
-
121
-
122
-
123
-
124
-
125
-
126
-
127
-
128
-
129
-
130
-
131
-
132
-
133
-
134
-
135
-
136
-
137
-
138
-
139
-
140
-
141
-
142
-
143
-
144
-
145
-
146
-
147
-
148
-
149
-
150
-
151
-
152
-
153
-
154
-
155
-
156
-
157
-
158
-
159
-
160
-
161
-
162
-
163
-
164
-
165
-
166
-
167
-
168
-
169
-
170
-
171
-
172
-
173
-
174
-
175
-
176
-
177
-
178
-
179
-
180
-
181
-
182
-
183
-
184
-
185
-
186
-
187
-
188
-
189
-
190
-
191
-
192
-
193
-
194
-
195
-
196
-
197
-
198
-
199
-
200
-
201
-
202
-
203
-
204
-
205
-
206
-
207
-
208
-
209
-
210
-
211
-
212
-
213
-
214
-
215
-
216
-
217
-
218
-
219
-
220
-
221
-
222
-
223
-
224
-
225
-
226
-
227
-
228
-
229
-
230
-
231
-
232
-
233
-
234
-
235
-
236
-
237
-
238
-
239
-
240
-
241
-
242
-
243
-
244
-
245
-
246
 |
 |

79REGISTRATION DOCUMENT − L’ORÉAL 2011
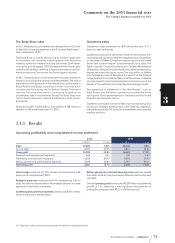
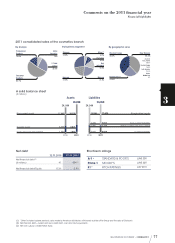
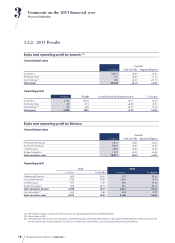
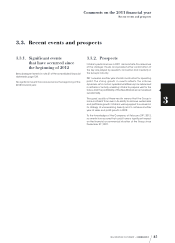
Comments on the2011 nancialyear
3
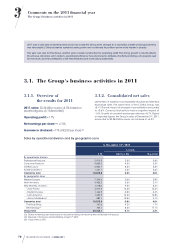
Financial highlights
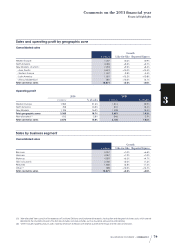
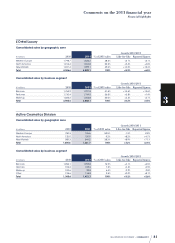
Sales and operating profit by geographic zone
Consolidated sales
€ millions
Growth
Like-for-like Reported figures
Western Europe 7,247 +0.6% +0.9%
North America 4,406 +5.5% +2.7%
New Markets. of which: 7,218 +9.5% +8.3%
- Asia, Pacific 3,619 +13.0% +13.4%
- Eastern Europe 1,337 -2.8% -4.4%
- Latin America 1,681 +13.2% +10.8%
- Africa, Middle-East 581 +10.5% +4.1%
Total cosmetics sales 18,871 +5.0% +4.0%
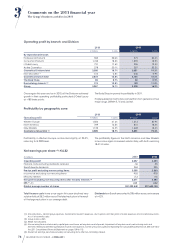
Operating profit
2010 2011
€ millions
% of sales
€ millions
% of sales
Western Europe 1,552 21.6% 1,513 20.9%
North America 708 16.5% 810 18.4%
New Markets 1,125 16.9% 1,328 18.4%
Total geographic zones 3,385 18.7% 3,651 19.3%
Non-allocated(1) -513 -2.8% - 546 -2.9%
Total cosmetics sales 2,872 15.8% 3,105 16.5%
Sales by business segment
Consolidated sales
€ millions
Growth
Like-for-like Reported figures
Skincare 5,257 +7.0% +6.5%
Haircare 4,057 +1.9% +1.0%
Make-up 4,029 +6.3% +4.7%
Hair colourants 2,760 +3.0% +1.6%
Perfumes 1,840 +3.8% +1.4%
Other(2) 928 +10.2 % +14 .7 %
Total cosmetics sales 18,871 +5.0% +4.0%
(1) “Non-allocated” items consist of the expenses of Functional Divisions and fundamental research, stock option and free grant of shares costs, which are not
allocated to the Cosmetics Divisions. This item also includes non core activities , such as insurance, reinsurance and banking.
(2) “Other” includes hygiene products,sales made by American distributors with brands outside of the Group and the sales of Clari sonic.