Loreal 2011 Annual Report Download - page 110
Download and view the complete annual report
Please find page 110 of the 2011 Loreal annual report below. You can navigate through the pages in the report by either clicking on the pages listed below, or by using the keyword search tool below to find specific information within the annual report.-
 1
1 -
2
-
3
-
4
-
5
-
6
-
7
-
8
-
9
-
10
-
11
-
12
-
13
-
14
-
15
-
16
-
17
-
18
-
19
-
20
-
21
-
22
-
23
-
24
-
25
-
26
-
27
-
28
-
29
-
30
-
31
-
32
-
33
-
34
-
35
-
36
-
37
-
38
-
39
-
40
-
41
-
42
-
43
-
44
-
45
-
46
-
47
-
48
-
49
-
50
-
51
-
52
-
53
-
54
-
55
-
56
-
57
-
58
-
59
-
60
-
61
-
62
-
63
-
64
-
65
-
66
-
67
-
68
-
69
-
70
-
71
-
72
-
73
-
74
-
75
-
76
-
77
-
78
-
79
-
80
-
81
-
82
-
83
-
84
-
85
-
86
-
87
-
88
-
89
-
90
-
91
-
92
-
93
-
94
-
95
-
96
-
97
-
98
-
99
-
 100
100 -
 101
101 -
 102
102 -
 103
103 -
 104
104 -
 105
105 -
 106
106 -
 107
107 -
 108
108 -
 109
109 -
 110
110 -
 111
111 -
 112
112 -
 113
113 -
 114
114 -
 115
115 -
 116
116 -
 117
117 -
 118
118 -
 119
119 -
 120
120 -
121
-
122
-
123
-
124
-
125
-
126
-
127
-
128
-
129
-
130
-
131
-
132
-
133
-
134
-
135
-
136
-
137
-
138
-
139
-
140
-
141
-
142
-
143
-
144
-
145
-
146
-
147
-
148
-
149
-
150
-
151
-
152
-
153
-
154
-
155
-
156
-
157
-
158
-
159
-
160
-
161
-
162
-
163
-
164
-
165
-
166
-
167
-
168
-
169
-
170
-
171
-
172
-
173
-
174
-
175
-
176
-
177
-
178
-
179
-
180
-
181
-
182
-
183
-
184
-
185
-
186
-
187
-
188
-
189
-
190
-
191
-
192
-
193
-
194
-
195
-
196
-
197
-
198
-
199
-
200
-
201
-
202
-
203
-
204
-
205
-
206
-
207
-
208
-
209
-
210
-
211
-
212
-
213
-
214
-
215
-
216
-
217
-
218
-
219
-
220
-
221
-
222
-
223
-
224
-
225
-
226
-
227
-
228
-
229
-
230
-
231
-
232
-
233
-
234
-
235
-
236
-
237
-
238
-
239
-
240
-
241
-
242
-
243
-
244
-
245
-
246
 |
 |

108 REGISTRATION DOCUMENT − L’ORÉAL 2011
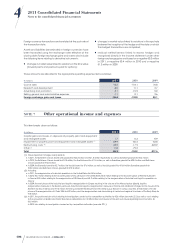
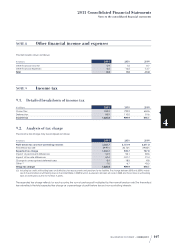
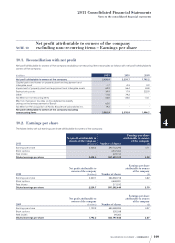
42011 Consolidated Financial Statements
Notes to the consolidated nancial statements
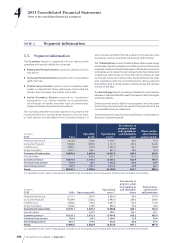
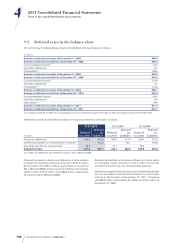
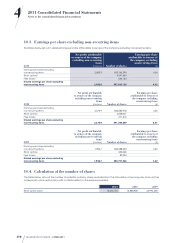
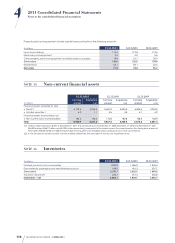
9.3. Deferred taxes in the balance sheet
The net change in deferred taxes (assets and liabilities) can be analysed as follows:
€ millions
Balance of deferred tax assets at December31st, 2008 498.9
Balance of deferred tax liabilities at December31st, 2008 -398.4
Income statement impact -51.6
Translation differences -6.1
Other effects (1) 108.6
Balance of deferred tax assets at December31st, 2009 570.8
Balance of deferred tax liabilities at December31st, 2009 -418.0
Income statement impact -110.0
Translation differences 6.7
Other effects(1) 114.6
Balance of deferred tax assets at December31st, 2010 626.1
Balance of deferred tax liabilities at December31st, 2010 -462.0
Income statement impact -85.9
Translation differences -5.6
Other effects(1) -78.9
Balance of deferred tax assets at December31st, 2011 671.4
Balance of deferred tax liabilities at December31st, 2011 -677.7
(1) Including mainly the tax effect on actuarial gains and losses recognised in equity and in2011 on newly consolidated companies for €100million.
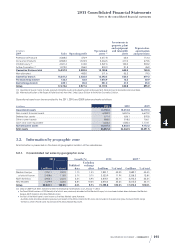
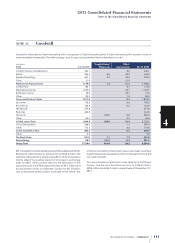
Deferred tax assets and liabilities recorded in the balance sheet may be broken as follows:
€ millions
12.31.2011 12.31.2010 12.31.2009
Deferred
tax assets
Deferred
tax
liabilities
Deferred
tax assets
Deferred
tax
liabilities
Deferred
tax assets
Deferred
tax
liabilities
Temporary differences 645.5 461.5 599.0 371.9 540.9 313.2
Deferred tax liabilities on remeasurement of Sanofi(1) 216.2 90.1 104.8
Tax credits and tax loss carry-forwards 25.9 27.1 29.9
Deferred tax total 671.4 677.7 626.1 462.0 570.8 418.0
(1) In2011, the deferred tax rate increased to 3.44% (1.72% in2010 and 2009).
Deferred tax assets on temporary differences mainly relate to
provisions for pensions and early retirement (€321.6 million,
€313.2million and €297.4million, respectively, at the end of
2011, 2010 and 2009) and provisi ons for liabilities and charges
(€164.1million, €197.9million and €180.5million, respectively,
at the end of 2011, 2010 and 2009).
Deferred tax liabilities on temporary differences mainly relate
to intangible assets acquired in the context of business
combinations other than non tax-deductible goodwill.
Deferred tax assets whose recovery is not considered probable
are not recorded in the financial statements; such assets
amount to €67.5million at December31st, 2011 compared
with €80.9million at December31st, 2010 and €91.0million at
December31st, 2009.