Loreal 2011 Annual Report Download - page 161
Download and view the complete annual report
Please find page 161 of the 2011 Loreal annual report below. You can navigate through the pages in the report by either clicking on the pages listed below, or by using the keyword search tool below to find specific information within the annual report.-
 1
1 -
2
-
3
-
4
-
5
-
6
-
7
-
8
-
9
-
10
-
11
-
12
-
13
-
14
-
15
-
16
-
17
-
18
-
19
-
20
-
21
-
22
-
23
-
24
-
25
-
26
-
27
-
28
-
29
-
30
-
31
-
32
-
33
-
34
-
35
-
36
-
37
-
38
-
39
-
40
-
41
-
42
-
43
-
44
-
45
-
46
-
47
-
48
-
49
-
50
-
51
-
52
-
53
-
54
-
55
-
56
-
57
-
58
-
59
-
60
-
61
-
62
-
63
-
64
-
65
-
66
-
67
-
68
-
69
-
70
-
71
-
72
-
73
-
74
-
75
-
76
-
77
-
78
-
79
-
80
-
81
-
82
-
83
-
84
-
85
-
86
-
87
-
88
-
89
-
90
-
91
-
92
-
93
-
94
-
95
-
96
-
97
-
98
-
99
-
100
-
101
-
102
-
103
-
104
-
105
-
106
-
107
-
108
-
109
-
110
-
111
-
112
-
113
-
114
-
115
-
116
-
117
-
118
-
119
-
120
-
121
-
122
-
123
-
124
-
125
-
126
-
127
-
128
-
129
-
130
-
131
-
132
-
133
-
134
-
135
-
136
-
137
-
138
-
139
-
140
-
141
-
142
-
143
-
144
-
145
-
146
-
147
-
148
-
149
-
150
-
 151
151 -
 152
152 -
 153
153 -
 154
154 -
 155
155 -
 156
156 -
 157
157 -
 158
158 -
 159
159 -
 160
160 -
 161
161 -
 162
162 -
 163
163 -
 164
164 -
 165
165 -
 166
166 -
 167
167 -
 168
168 -
 169
169 -
 170
170 -
 171
171 -
172
-
173
-
174
-
175
-
176
-
177
-
178
-
179
-
180
-
181
-
182
-
183
-
184
-
185
-
186
-
187
-
188
-
189
-
190
-
191
-
192
-
193
-
194
-
195
-
196
-
197
-
198
-
199
-
200
-
201
-
202
-
203
-
204
-
205
-
206
-
207
-
208
-
209
-
210
-
211
-
212
-
213
-
214
-
215
-
216
-
217
-
218
-
219
-
220
-
221
-
222
-
223
-
224
-
225
-
226
-
227
-
228
-
229
-
230
-
231
-
232
-
233
-
234
-
235
-
236
-
237
-
238
-
239
-
240
-
241
-
242
-
243
-
244
-
245
-
246
 |
 |

159REGISTRATION DOCUMENT − L’ORÉAL 2011
2011 parent company Financial Statements
5
Notes to the parent company nancial statements
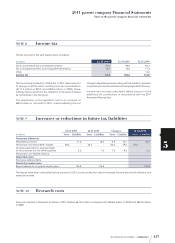
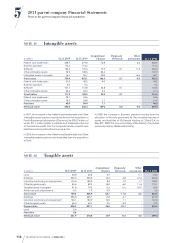
Depreciation and amortisation recognised in2011 against tangible and intangible assets included:
♦a charge of €51.6million on a straight-line basis;
♦a charge of €12.7million on a declining-balance basis;
♦a charge of €2.7million relating to exceptional depreciation and amortisation.
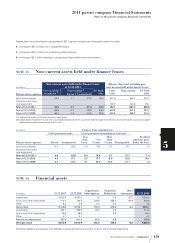
NOTE13 Non-current assets held under finance leases
€ millions
Non-current assets held under finance leases
at 12.31.2011 Balance sheet total including non-
current assets held under finance leases
Balance sheet captions
Cost on initial
recognition(1) Depreciation(2) Net book
value
Gross
value
Depreciation Net book
value
Period Accumulated
Land and buildings 43.5 -1.7 -21.0 22.5 571.8 -340.1 231.7
Industrial machinery
and equipment - - - - 190.9 -161.8 29.1
Total at 12.31.2011 43.5 -1.7 -21.0 22.5 762.7 -501.9 260.8
Total at 12.31.2010 43.5 -1.7 -19.3 24.2 679.0 -477.3 201.7
Total at 12.31.2009 43.1 -1.3 -17.6 25.5 675.9 -459.2 216.7
(1) Value of the assets on the date the leases were signed.
(2) Depreciation charge for the year and accumulated depreciation that would have been recognised for these assets had they been purchased outright –
Depreciation method used: straight-line 2% to 5%.
€ millions
Finance lease commitments
Balance sheet captions
Lease payments made Lease payments outstanding at year-end
Residual
purchase price
under the leasePeriod Accumulated
Less
than
1year
1 to
5years
More
than
5years Total payable
Land and buildings 4.9 62.0 5.4 19.6 2.7 27.7 1.4
Industrial machinery
and equipment - - - - - - -
Total at 12.31.2011 4.9 62.0 5.4 19.6 2.7 27.7 1.4
Total at 12.31.2010 4.8 57.1 5.3 19.7 8.0 33.0 90.1
Total at 12.31.2009 4.3 52.2 5.1 20.0 12.6 37.7 1.4
NOTE14 Financial assets
€ millions
12.31.2009 12.31.2010
Acquisitions/
Subscriptions
Disposals/
Reductions
Other
movements 12.31.2011
Investments 9,030.9 9,027.0 1.2 -1.4 20.7 9,047.5
Loans and other receivables 170.7 125.3 768.8 -368.4 -20.9 504.8
Other 8.4 3.8 0.4 -0.4 - 3.8
Gross value 9,210.0 9,156.1 770.4 -370.2 -0.2 9556.1
Investments 302.7 298.2 24.2 -7.8 - 314.6
Loans and other receivables 29.8 38.3 - -2.0 - 36.3
Other 4.7 4.7 - - - 4.7
Provision for impairment 337.2 341.2 24.2 -9.8 - 355.6
Net book value 8,872.8 8,814.9 746.2 -360.4 -0.2 9,200.5
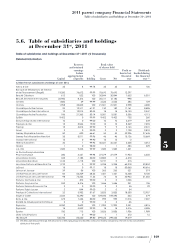
The table detailing subsidiaries and affiliates is presented at the end of the notes to the financial statements.