Loreal 2011 Annual Report Download - page 111
Download and view the complete annual report
Please find page 111 of the 2011 Loreal annual report below. You can navigate through the pages in the report by either clicking on the pages listed below, or by using the keyword search tool below to find specific information within the annual report.-
 1
1 -
2
-
3
-
4
-
5
-
6
-
7
-
8
-
9
-
10
-
11
-
12
-
13
-
14
-
15
-
16
-
17
-
18
-
19
-
20
-
21
-
22
-
23
-
24
-
25
-
26
-
27
-
28
-
29
-
30
-
31
-
32
-
33
-
34
-
35
-
36
-
37
-
38
-
39
-
40
-
41
-
42
-
43
-
44
-
45
-
46
-
47
-
48
-
49
-
50
-
51
-
52
-
53
-
54
-
55
-
56
-
57
-
58
-
59
-
60
-
61
-
62
-
63
-
64
-
65
-
66
-
67
-
68
-
69
-
70
-
71
-
72
-
73
-
74
-
75
-
76
-
77
-
78
-
79
-
80
-
81
-
82
-
83
-
84
-
85
-
86
-
87
-
88
-
89
-
90
-
91
-
92
-
93
-
94
-
95
-
96
-
97
-
98
-
99
-
100
-
 101
101 -
 102
102 -
 103
103 -
 104
104 -
 105
105 -
 106
106 -
 107
107 -
 108
108 -
 109
109 -
 110
110 -
 111
111 -
 112
112 -
 113
113 -
 114
114 -
 115
115 -
 116
116 -
 117
117 -
 118
118 -
 119
119 -
 120
120 -
 121
121 -
122
-
123
-
124
-
125
-
126
-
127
-
128
-
129
-
130
-
131
-
132
-
133
-
134
-
135
-
136
-
137
-
138
-
139
-
140
-
141
-
142
-
143
-
144
-
145
-
146
-
147
-
148
-
149
-
150
-
151
-
152
-
153
-
154
-
155
-
156
-
157
-
158
-
159
-
160
-
161
-
162
-
163
-
164
-
165
-
166
-
167
-
168
-
169
-
170
-
171
-
172
-
173
-
174
-
175
-
176
-
177
-
178
-
179
-
180
-
181
-
182
-
183
-
184
-
185
-
186
-
187
-
188
-
189
-
190
-
191
-
192
-
193
-
194
-
195
-
196
-
197
-
198
-
199
-
200
-
201
-
202
-
203
-
204
-
205
-
206
-
207
-
208
-
209
-
210
-
211
-
212
-
213
-
214
-
215
-
216
-
217
-
218
-
219
-
220
-
221
-
222
-
223
-
224
-
225
-
226
-
227
-
228
-
229
-
230
-
231
-
232
-
233
-
234
-
235
-
236
-
237
-
238
-
239
-
240
-
241
-
242
-
243
-
244
-
245
-
246
 |
 |

109REGISTRATION DOCUMENT − L’ORÉAL 2011
2011 Consolidated Financial Statements
4
Notes to the consolidated nancial statements
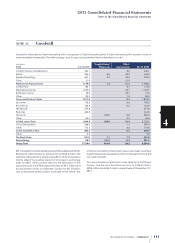
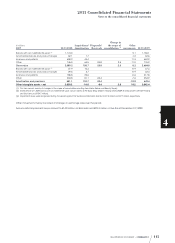
NOTE10
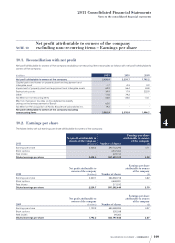
Net profit attributable to owners ofthec ompany
excluding non-recurring items – Earnings per share
10.1. Reconciliation with net profit
Net profit attributable to owners of the c ompany excluding non-recurring items reconciles as follows with net profit attributable to
owners of the c ompany:
€ millions
2011 2010 2009
Net profit attributable to owners of the c ompany 2,438.4 2,239.7 1,792.2
Capital gains and losses on property, plant and equipment and
intangible asset -1.7 -0.3 0.9
Impairment of property, plant and equipment and intangible assets 69.9 56.4 53.8
Restructuring costs 39.9 17.9 222.9
Other -11.8 79.2 -
Tax effect on non-recurring items -33.0 -22.0 -73.1
Effect of changes in tax rates on the deferred tax liability
arising on the remeasurement of Sanofi 62.0 - -
Tax effect on the acquisition of Pacific Bioscience Laboratories Inc. 19.2 - -
Net profit attributable to owners of the c ompany excluding
non-recurring items 2,582.9 2,370.9 1,996.7
10.2. Earnings per share
The tables below set out earnings per share attributable to owners of the c ompany:
2011
Net profit attributable to
owners of the c ompany
(€ millions) Number of shares
Earnings per share
attributable to owners
of the c ompany
(€)
Earnings per share 2,438.4 592,763,295 4.11
Stock options - 4,247,654
Free shares - 622,154
Diluted earnings per share 2,438.4 597,633,103 4.08
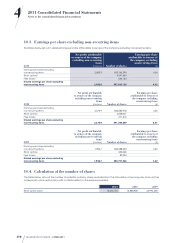
2010
Net profit attributable to
owners of the c ompany
(€ millions) Number of shares
Earnings per share
attributable to owners
of the c ompany
(€)
Earnings per share 2,239.7 586,582,918 3.82
Stock options - 4,538,021
Free shares - 271,510
Diluted earnings per share 2,239.7 591,392,449 3.79
2009
Net profit attributable to
owners of the c ompany
(€ millions) Number of shares
Earnings per share
attributable to owners
of the c ompany
(€)
Earnings per share 1,792.2 583,388,024 3.07
Stock options - 320,338
Free shares - 89,204
Diluted earnings per share 1,792.2 583,797,566 3.07