Loreal 2011 Annual Report Download - page 137
Download and view the complete annual report
Please find page 137 of the 2011 Loreal annual report below. You can navigate through the pages in the report by either clicking on the pages listed below, or by using the keyword search tool below to find specific information within the annual report.-
 1
1 -
2
-
3
-
4
-
5
-
6
-
7
-
8
-
9
-
10
-
11
-
12
-
13
-
14
-
15
-
16
-
17
-
18
-
19
-
20
-
21
-
22
-
23
-
24
-
25
-
26
-
27
-
28
-
29
-
30
-
31
-
32
-
33
-
34
-
35
-
36
-
37
-
38
-
39
-
40
-
41
-
42
-
43
-
44
-
45
-
46
-
47
-
48
-
49
-
50
-
51
-
52
-
53
-
54
-
55
-
56
-
57
-
58
-
59
-
60
-
61
-
62
-
63
-
64
-
65
-
66
-
67
-
68
-
69
-
70
-
71
-
72
-
73
-
74
-
75
-
76
-
77
-
78
-
79
-
80
-
81
-
82
-
83
-
84
-
85
-
86
-
87
-
88
-
89
-
90
-
91
-
92
-
93
-
94
-
95
-
96
-
97
-
98
-
99
-
100
-
101
-
102
-
103
-
104
-
105
-
106
-
107
-
108
-
109
-
110
-
111
-
112
-
113
-
114
-
115
-
116
-
117
-
118
-
119
-
120
-
121
-
122
-
123
-
124
-
125
-
126
-
 127
127 -
 128
128 -
 129
129 -
 130
130 -
 131
131 -
 132
132 -
 133
133 -
 134
134 -
 135
135 -
 136
136 -
 137
137 -
 138
138 -
 139
139 -
 140
140 -
 141
141 -
 142
142 -
 143
143 -
 144
144 -
 145
145 -
 146
146 -
 147
147 -
148
-
149
-
150
-
151
-
152
-
153
-
154
-
155
-
156
-
157
-
158
-
159
-
160
-
161
-
162
-
163
-
164
-
165
-
166
-
167
-
168
-
169
-
170
-
171
-
172
-
173
-
174
-
175
-
176
-
177
-
178
-
179
-
180
-
181
-
182
-
183
-
184
-
185
-
186
-
187
-
188
-
189
-
190
-
191
-
192
-
193
-
194
-
195
-
196
-
197
-
198
-
199
-
200
-
201
-
202
-
203
-
204
-
205
-
206
-
207
-
208
-
209
-
210
-
211
-
212
-
213
-
214
-
215
-
216
-
217
-
218
-
219
-
220
-
221
-
222
-
223
-
224
-
225
-
226
-
227
-
228
-
229
-
230
-
231
-
232
-
233
-
234
-
235
-
236
-
237
-
238
-
239
-
240
-
241
-
242
-
243
-
244
-
245
-
246
 |
 |

135REGISTRATION DOCUMENT − L’ORÉAL 2011
2011 Consolidated Financial Statements
4
Notes to the consolidated nancial statements
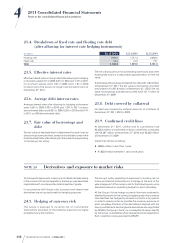
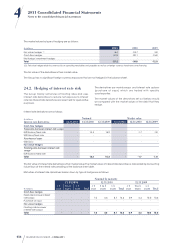
24.3. Sensitivity to changes
ininterest rates
An increase of 100basis points in interest rates would have
a direct positive impact of €5.6million on the Group’s net
finance costs at December31st, 2011, compared with a
positive impact of €0.5million at December31st, 2010 and a
negative impact of €18.6million at December31st, 2009. This
calculation allows for cash, cash equivalents and derivatives,
and assumes that total net debt/net cash remains stable
and that fixed-rate debt at maturity is replaced by floating-
rate debt.
The impact of a 100basis point rise in interest rates on
the fair value of the Group’s fixed-rate financial assets and
liabilities, after allowing for derivatives, can be estimated
at €0.2million at December31st, 2011 compared with
€1.3million at December31st, 2010 and €1.2million at
December31st, 2009.
24.4. Counterparty risk
The Group has financial relations with international banks rated
investment grade. The Group thus considers that its exposure
to counterparty risk is low.
Furthermore, the financial instruments used to manage
exchange rate and interest rate risk are issued by leading
international banking counterparties.
24.5. Liquidity risk
The Group’s liquidity risk can be assessed on the basis of its
outstanding short-term debt under its paper programme
totalling €795.7million. If these bank facilities were not renewed,
the Group had confirmed undrawn credit lines of €2,438.6million
at December31st, 2011. The availability of these credit lines is
not dependent on financial covenants.
24.6. Shareholding risk
No cash has been invested in shares.
Available cash is invested with top-ranking financial institutions
in the form of non-speculative instruments which can be drawn
in very short periods. At December31st, 2011, cash was invested
exclusively in Euro-zone government bonds through mutual
funds (note19).
At December31st, 2011, the Group holds 118,227,307 Sanofi
shares for an amount of €6,709.4million (note15). A change
of plus or minus 10% in the market price of these shares relative
to the market price of €56.75on December31st, 2011 would
have an impact of plus or minus €670.9million before tax on
Group equity.
If the share price were to fall significantly below €34.12 (the initial
cost of the Sanofi shares), or fall below that price for a prolonged
length of time, L’Oréal may have to recognise an impairment
loss on its asset through profit or loss.
At December31st, 2010, the Group held 118,227,307 Sanofi
shares for an amount of €5,657.2million (note15). A change
of plus or minus 10% in the market price of these shares relative
to the market price of €47.85on December31st, 2010 would
have an impact of plus or minus €565.7million before tax on
Group equity.
At December31st, 2009, the Group held 118,227,307 Sanofi
shares for an amount of €6,509.6million (note15). A change
of plus or minus 10% in the market price of these shares relative
to the market price of €55.06on December31st, 2009 would
have an impact of plus or minus €651.0million before tax on
Group equity.
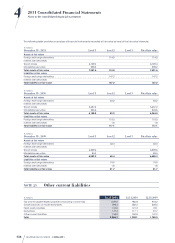
24.7. Fair value hierarchy
IFRS7 as amended in2009 requires financial assets and liabilities
recognised at fair value in the balance sheet to be classified
according to three levels:
♦level 1: quoted prices on an active market;
♦level 2: valuation techniques using observable inputs;
♦level 3: valuation techniques using unobservable inputs.