LG 1999 Annual Report Download - page 43
Download and view the complete annual report
Please find page 43 of the 1999 LG annual report below. You can navigate through the pages in the report by either clicking on the pages listed below, or by using the keyword search tool below to find specific information within the annual report.-
 1
1 -
2
-
3
-
4
-
5
-
6
-
7
-
8
-
9
-
10
-
11
-
12
-
13
-
14
-
15
-
16
-
17
-
18
-
19
-
20
-
21
-
22
-
23
-
24
-
25
-
26
-
27
-
28
-
29
-
30
-
31
-
32
-
 33
33 -
 34
34 -
 35
35 -
 36
36 -
 37
37 -
 38
38 -
 39
39 -
 40
40 -
 41
41 -
 42
42 -
 43
43 -
 44
44 -
 45
45 -
 46
46 -
 47
47 -
 48
48 -
 49
49 -
 50
50 -
 51
51 -
 52
52
 |
 |

1
4
NOTES TO FINANCIAL STATEMENTS
For the year ended December 31, 1999
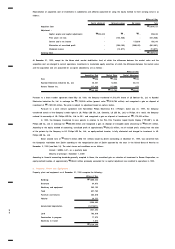
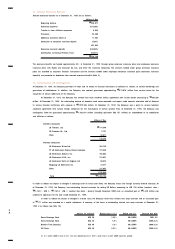
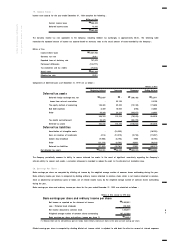
19. Income Taxes :
Income taxe expense for the year ended December 31, 1999 comprise the following :
Millions of Won
Current income taxes
₩
566,892
Deferred income taxes 15,992
₩
582,884
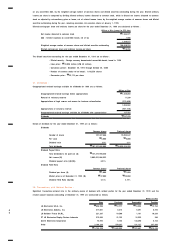
The statutory income tax rate applicable to the Company, including resident tax surcharges, is approximately 30.8%. The following table
reconciles the expected amount of income tax expense based on statutory rates to the actual amount of taxes recorded by the Company :
Millions of Won
Income before taxes
₩
2,587,905
Statutory tax rate 30.8%
Expected taxes at statutory rate 797,075
Permanent differences (134,777)
Tax exemption and tax credits (79,414)
Actual taxes
₩
582,884
Effective tax rate 22.5%
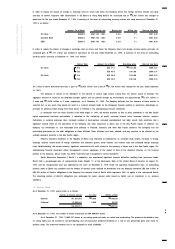
Components of deferred taxes as of December 31, 1999 are as follows :
Millions of Won
Beginning balance Increases Decreases Ending balance
Deferred tax assets
Deferred foreign exchange loss, net
₩
52,607
₩
-
₩
(30,196)
₩
22,411
Losses from sales of receivables - 33,130 - 33,130
The equity method of accounting 148,485 39,293 (12,120) 175,658
Bad debt expenses 8,409 16,663 (390) 24,682
Other 39,268 23,224 (33,857) 28,635
248,769 112,310 (76,563) 284,516
Tax credits carried-forward 33,479 - (33,479) -
Deferred tax assets 282,248 112,310 (110,042) 284,516
Deferred tax liabilities
Amortization of intangible assets - (18,299) - (18,299)
Gain on valuation of investments 4,158 (12,519) (2,736) (11,097)
Custom duty drawback (9,906) (8,198) 9,906 (8,198)
Other (22,219) (6,765) 20,351 (8,633)
Deferred tax liabilities (27,967) (45,781) 27,521 (46,227)
Net deferred tax assets
₩
254,281
₩
66,529
₩
(82,521)
₩
238,289
The Company periodically assesses its ability to recover deferred tax assets. In the event of significant uncertainty regarding the Company’s
ultimate ability to recover such assets, a valuation allowance is recorded to reduce the asset to its estimated net realizable value.
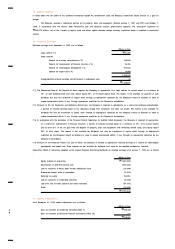
20. Earnings Per Share :
Basic earnings per share are computed by dividing net income by the weighted average number of common shares outstanding during the year.
Basic ordinary income per share is computed by dividing ordinary income allocated to common stock, which is net income allocated to common
stock as adjusted by extraordinary gains or losses, net of related income taxes, by the weighted average number of common shares outstanding
during the year.
Basic earnings per share and ordinary income per share for the year ended December 31, 1999 are calculated as follows :
Millions of Won (except for EPS data)
Basic earnings per share and ordinary income per share
Net income as reported on the statement of income
₩
2,005,021
Less : Preferred stock dividends (20,050)
Net income allocated to common stock 1,984,971
Weighted average number of common shares outstanding 107,327,666
Basic earnings per share and ordinary income per share (* )
₩
18,494
(* ) Because there are no extraordinary gains or losses, basic ordinary income per share is the same as basic earings per share.
Diluted earnings per share is computed by dividing diluted net income, which is adjusted to add back the after-tax amount of interest expenses