LG 1999 Annual Report Download - page 3
Download and view the complete annual report
Please find page 3 of the 1999 LG annual report below. You can navigate through the pages in the report by either clicking on the pages listed below, or by using the keyword search tool below to find specific information within the annual report.-
 1
1 -
 2
2 -
 3
3 -
 4
4 -
 5
5 -
 6
6 -
 7
7 -
 8
8 -
 9
9 -
 10
10 -
 11
11 -
 12
12 -
 13
13 -
 14
14 -
15
-
16
-
17
-
18
-
19
-
20
-
21
-
22
-
23
-
24
-
25
-
26
-
27
-
28
-
29
-
30
-
31
-
32
-
33
-
34
-
35
-
36
-
37
-
38
-
39
-
40
-
41
-
42
-
43
-
44
-
45
-
46
-
47
-
48
-
49
-
50
-
51
-
52
 |
 |
1
0
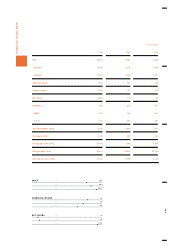
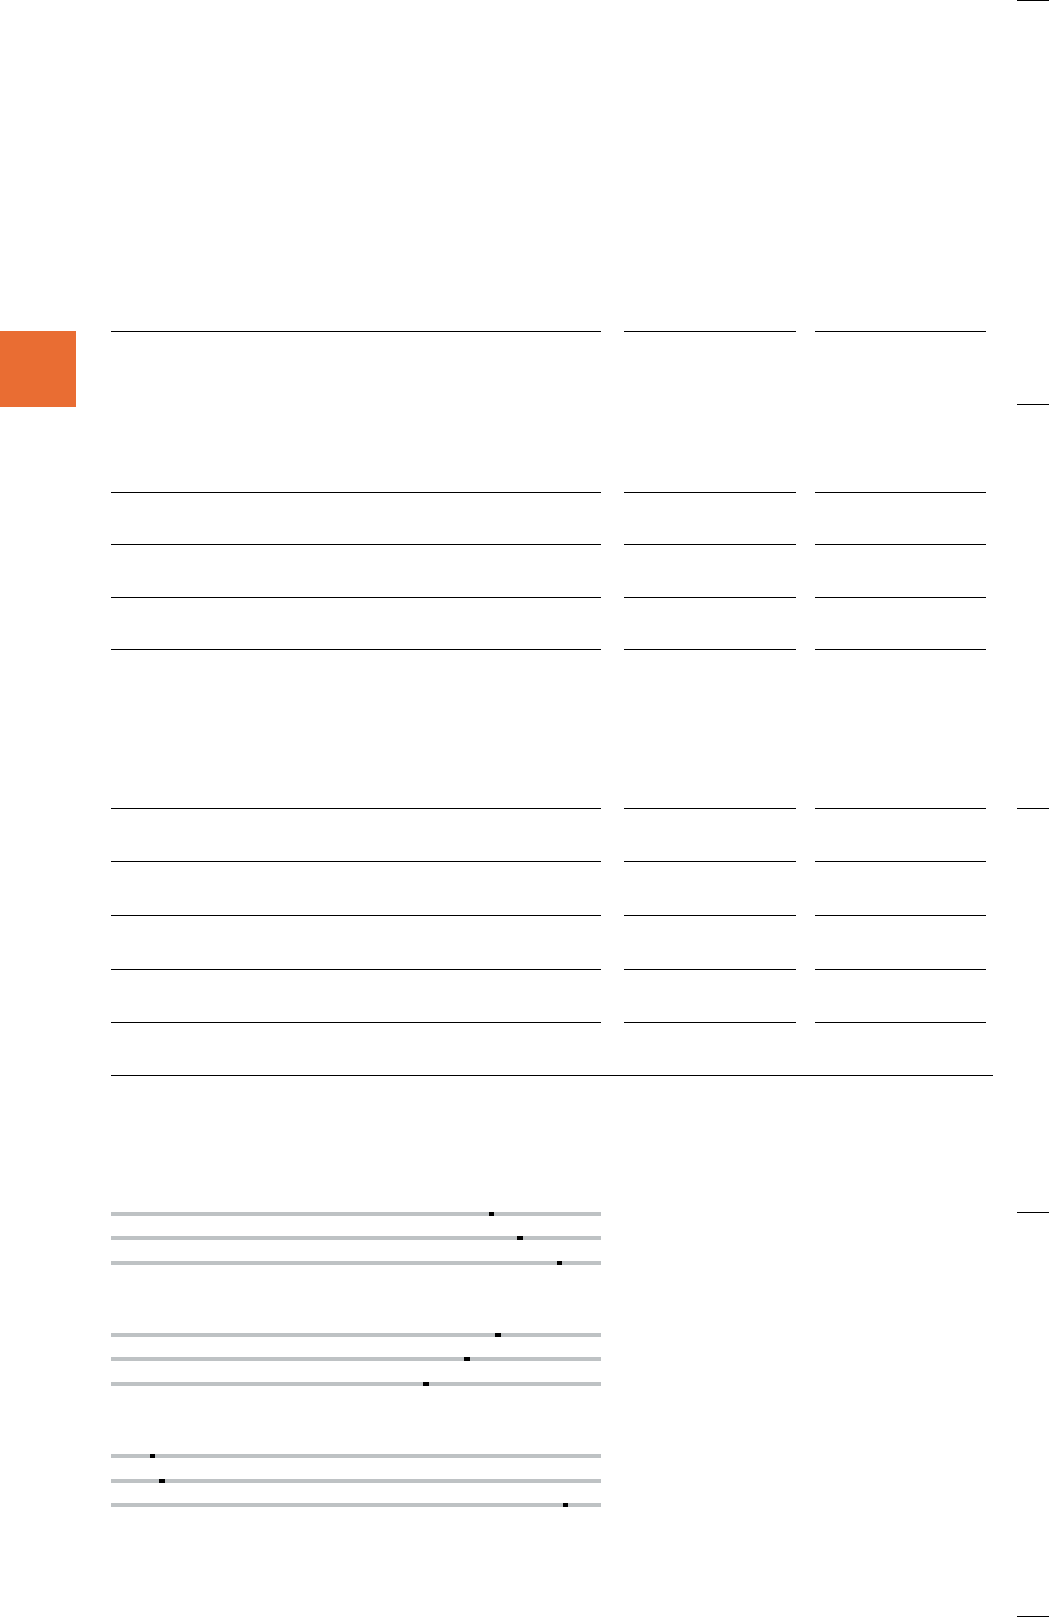
FINANCIAL HIGHLIGHTS
(Unit: billion KRW)
1999 1998 1997
Sales 10,546 9,853 9,240
- Domestic 2,704 2,570 3,503
- Overseas 7,842 7,283 5,737
Operating income 684 753 798
Ordinary income 2,588 167 116
Net income 2,005 112 92
Investment 826 921 978
- CAPEX 407 494 543
- R & D 419 427 435
Total shareholders' equity 3,186 1,834 1,527
Total capital stock 632 632 525
Earnings per share (Won) 18,494 1,264 1,034
Sales per share (Won) 83,419 93,432 87,429
Cash flow per share (Won) 21,949 6,470 5,110
1997
1998
1999
1997
1998
1999
1997
1998
1999
SALES
OPERATING INCOME
NET INCOME
9,240
9,853
10,546
798
753
684
92
112
2,005