Home Depot 1999 Annual Report Download - page 41
Download and view the complete annual report
Please find page 41 of the 1999 Home Depot annual report below. You can navigate through the pages in the report by either clicking on the pages listed below, or by using the keyword search tool below to find specific information within the annual report.-
 1
1 -
2
-
3
-
4
-
5
-
6
-
7
-
8
-
9
-
10
-
11
-
12
-
13
-
14
-
15
-
16
-
17
-
18
-
19
-
20
-
21
-
22
-
23
-
24
-
25
-
26
-
27
-
28
-
29
-
30
-
 31
31 -
 32
32 -
 33
33 -
 34
34 -
 35
35 -
 36
36 -
 37
37 -
 38
38 -
 39
39 -
 40
40 -
 41
41 -
 42
42
 |
 |

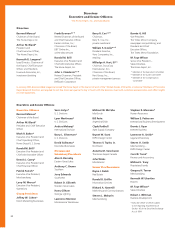
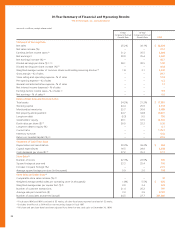
The Home Depot, Inc. and Subsidiaries
1998 1997 1996(1) 1995 1994 1993 1992 1991 1990(1)
$ 30,219 $ 24,156 $ 19,535 $ 15,470 $ 12,477 $ 9,239 $ 7,148 $ 5,137 $ 3,815
25.1 23.7 26.3 24.0 35.0 29.2 39.2 34.6 38.3
2,654 2,002 1,535 1,195 980 737 576 396 260
1,614 1,224 938 732 605 457 363 249 163
31.9 30.5 28.2 21.0 32.2 26.1 45.6 52.5 46.0
0.71 0.55 0.43 0.34 0.29 0.22 0.18 0.13 0.10
29.1 27.9 26.5 17.2 31.8 22.2 38.5 30.0 42.9
2,320 2,287 2,195 2,151 2,142 2,132 2,096 1,985 1,824
28.5 28.1 27.8 27.7 27.9 27.7 27.6 28.1 27.9
17.7 17.8 18.0 18.0 17.8 17.6 17.4 18.1 18.2
0.3 0.3 0.3 0.4 0.4 0.4 0.4 0.3 0.4
1.7 1.7 1.7 1.7 1.8 2.0 2.1 2.3 2.4
– – 0.1 0.1 (0.1) 0.3 0.4 0.3 (0.1)
8.8 8.3 7.9 7.7 7.8 8.0 8.1 7.7 6.8
5.3 5.1 4.8 4.7 4.8 5.0 5.1 4.8 4.3
$ 13,465 $ 11,229 $ 9,342 $ 7,354 $ 5,778 $ 4,701 $ 3,932 $ 2,510 $ 1,640
2,076 2,004 1,867 1,255 919 994 807 624 301
4,293 3,602 2,708 2,180 1,749 1,293 940 662 509
8,160 6,509 5,437 4,461 3,397 2,371 1,608 1,255 879
1,566 1,303 1,247 720 983 874 844 271 531
8,740 7,098 5,955 4,988 3,442 2,814 2,304 1,691 683
3.95 3.23 2.75 2.32 1.69 1.39 1.15 0.89 0.43
17.9 18.4 20.9 14.4 28.6 31.1 36.6 16.0 77.7
1.73:1 1.82:1 2.01:1 1.89:1 1.76:1 2.02:1 2.07:1 2.17:1 1.73:1
5.4x 5.4x 5.6x 5.5x 5.7x 5.9x 6.3x 6.1x 6.0x
19.3 17.0 16.3 16.3 16.5 13.9 17.6 19.8 20.6
$ 373 $ 283 $ 232 $ 181 $ 130 $ 90 $ 70 $ 52 $ 34
2,094 1,464 1,248 1,308 1,220 900 437 432 400
0.08 0.06 0.05 0.04 0.03 0.02 0.02 0.01 0.01
761 624 512 423 340 264 214 174 145
81 66 54 44 35 26 21 16 13
22.8 23.1 21.6 26.3 33.2 26.3 26.8 24.1 27.4
107 106 105 105 103 100 98 95 92
777387151110
$ 844 $ 829 $ 803 $ 787 $ 802 $ 764 $ 724 $ 633 $ 566
410 406 398 390 404 398 387 348 322
665 550 464 370 302 236 189 146 112
45.05 43.63 42.09 41.78 41.29 39.13 37.72 35.13 33.92
156,700 124,400 98,100 80,800 67,300 50,600 38,900 28,000 21,500
(4) Diluted earnings per share for fiscal 1997, including a $104 million non-recurring charge, were $0.52 (see note 8 of the Notes to Consolidated Financial Statements).
(5) Excludes Apex Supply Company, Georgia Lighting, Maintenance Warehouse, and National Blinds and Wallpaper.
(6) Adjusted to reflect the first 52 weeks of the 53-week fiscal years in 1996 and 1990.