Home Depot 1999 Annual Report Download - page 23
Download and view the complete annual report
Please find page 23 of the 1999 Home Depot annual report below. You can navigate through the pages in the report by either clicking on the pages listed below, or by using the keyword search tool below to find specific information within the annual report.-
 1
1 -
2
-
3
-
4
-
5
-
6
-
7
-
8
-
9
-
10
-
11
-
12
-
 13
13 -
 14
14 -
 15
15 -
 16
16 -
 17
17 -
 18
18 -
 19
19 -
 20
20 -
 21
21 -
 22
22 -
 23
23 -
 24
24 -
 25
25 -
 26
26 -
 27
27 -
 28
28 -
 29
29 -
 30
30 -
 31
31 -
 32
32 -
 33
33 -
34
-
35
-
36
-
37
-
38
-
39
-
40
-
41
-
42
 |
 |

The Home Depot, Inc. and Subsidiaries
Forward-Looking Statements
Certain written and oral statements made by The Home Depot, Inc.
and subsidiaries (the “Company”) or with the approval of an author-
ized executive officer of the Company may constitute “forward-
looking statements” as defined under the Private Securities Litigation
Reform Act of 1995. Words or phrases such as “should result,” “are
expected to,” “we anticipate,” “we estimate,” “we project” or similar
expressions are intended to identify forward-looking statements.
These statements are subject to certain risks and uncertainties that
could cause actual results to differ materially from the Company’s
historical experience and its present expectations or projections. These
risks and uncertainties include, but are not limited to, unanticipated
weather conditions; stability of costs and availability of sourcing
channels; the ability to attract, train and retain highly-qualified
associates; conditions affecting the availability, acquisition, devel-
opment and ownership of real estate; general economic conditions;
the impact of competition; and regulatory and litigation matters.
Caution should be taken not to place undue reliance on any such
forward-looking statements, since such statements speak only as of
the date of the making of such statements. Additional information
concerning these risks and uncertainties is contained in the
Company’s filings with the Securities and Exchange Commission,
including the Company’s Annual Report on Form 10-K.
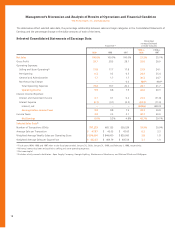
Results of Operations
For an understanding of the significant factors that influenced the
Company’s performance during the past three fiscal years, the follow-
ing discussion should be read in conjunction with the consolidated
financial statements and the notes to consolidated financial statements
presented in this annual report.
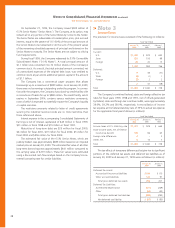
Fiscal year ended January 30, 2000 compared to
January 31, 1999
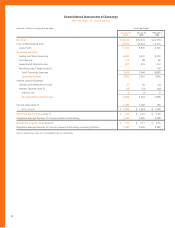
Net sales for fiscal 1999 increased 27.2% to $38.4 billion from
$30.2 billion in fiscal 1998. This increase was attributable to, among
other things, full year sales from the 138 new stores opened during
fiscal 1998, a 10% comparable store-for-store sales increase, and
169 new store openings and 6 store relocations during fiscal 1999.
Gross profit as a percent of sales was 29.7% for fiscal 1999
compared to 28.5% for fiscal 1998. The rate increase was primarily
attributable to a lower cost of merchandise resulting from product line
reviews and increased sales of imported products, other merchandis-
ing initiatives begun in prior years and continued during fiscal 1999,
and sales mix shifts to higher gross margin product categories and
assortments. In addition, inventory and refund systems improvements
and more effective training resulted in better inventory shrink results
and lower product markdowns.
Operating expenses as a percent of sales were 19.8% for fiscal
1999 compared to 19.7% for fiscal 1998. Selling and store operating
expenses as a percent of sales increased to 17.8% in fiscal 1999 from
17.7% in fiscal 1998. The increase was primarily attributable to higher
store selling payroll expenses resulting from market wage pressures
and an increase in employee longevity, as well as to the Company’s
continued investment in new customer service initiatives. In addition,
medical costs increased due to higher family enrollment in the
Company’s medical plans, increased claims and higher prescription
drug costs. The Company’s strong financial performance during fiscal
1999 also resulted in higher bonus expenses as a percent of sales.
Credit card discounts increased as a result of higher penetrations of
credit card sales and increases in non-private label discount rates.
Partially offsetting these increases were lower net advertising
expenses resulting from higher cooperative advertising participation
by vendors and economies realized from the increased use of
national advertising.
Pre-opening expenses as a percent of sales were 0.3% for both
fiscal 1999 and 1998. The Company opened 169 new stores and relo-
cated 6 stores in fiscal 1999, compared to 138 new stores and
4 store relocations in fiscal 1998. Pre-opening expenses averaged
$643,000 per store in fiscal 1999 compared to $618,000 per store in
fiscal 1998. The higher average expense was primarily due to the open-
ing of more EXPO Design Center stores and expansion into certain new
Home Depot markets, which involved longer pre-opening periods and
higher training, travel and relocation costs.
General and administrative expenses as a percent of sales were
1.7% for both fiscal 1999 and 1998. Incremental expenses related
to long-term growth and business planning initiatives, including
Internet development, international operations and the opening of
four new divisional offices, were offset by efficiencies realized from
increased sales.
Interest and investment income as a percent of sales was 0.1% for
both fiscal 1999 and 1998. Interest expense as a percent of sales was
0.1% for both comparable periods.
The Company’s combined federal and state effective income
tax rate decreased to 39.0% for fiscal 1999 from 39.2% for fiscal
1998. The decrease was attributable to higher tax credits in fiscal 1999
compared to fiscal 1998.
Net earnings as a percent of sales were 6.0% for fiscal 1999
compared to 5.3% for fiscal 1998, reflecting a higher gross profit rate
partially offset by higher operating expenses as a percent of sales as
described above. Diluted earnings per share were $1.00 for fiscal 1999
compared to $0.71 for fiscal 1998.
19