Home Depot 1999 Annual Report Download - page 29
Download and view the complete annual report
Please find page 29 of the 1999 Home Depot annual report below. You can navigate through the pages in the report by either clicking on the pages listed below, or by using the keyword search tool below to find specific information within the annual report.-
 1
1 -
2
-
3
-
4
-
5
-
6
-
7
-
8
-
9
-
10
-
11
-
12
-
13
-
14
-
15
-
16
-
17
-
18
-
 19
19 -
 20
20 -
 21
21 -
 22
22 -
 23
23 -
 24
24 -
 25
25 -
 26
26 -
 27
27 -
 28
28 -
 29
29 -
 30
30 -
 31
31 -
 32
32 -
 33
33 -
 34
34 -
 35
35 -
 36
36 -
 37
37 -
 38
38 -
 39
39 -
40
-
41
-
42
 |
 |

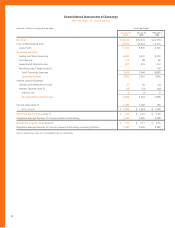
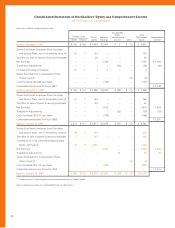
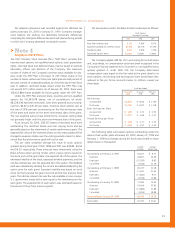
Consolidated Statements of Cash Flows
The Home Depot, Inc. and Subsidiaries
amounts in millions Fiscal Year Ended
January 30, January 31, February 1,
2000 1999 1998
Cash Provided from Operations:
Net Earnings $ 2,320 $ 1,614 $ 1,160
Reconciliation of Net Earnings to Net Cash Provided by Operations:
Depreciation and Amortization 463 373 283
(Increase) Decrease in Receivables, net (85) 85 (166)
Increase in Merchandise Inventories (1,142) (698) (885)
Increase in Accounts Payable and Accrued Expenses 820 423 577
Increase in Income Taxes Payable 93 59 83
Other (23) 61 (23)
Net Cash Provided by Operations 2,446 1,917 1,029
Cash Flows from Investing Activities:
Capital Expenditures, net of $37, $41 and $44 of non-cash capital expenditures
in fiscal 1999, 1998 and 1997, respectively (2,581) (2,053) (1,420)
Purchase of Remaining Interest in The Home Depot Canada –(261) –
Payments for Businesses Acquired, net (101) (6) (61)
Proceeds from Sales of Property and Equipment 87 45 85
Purchases of Investments (32) (2) (194)
Proceeds from Maturities of Investments 30 4 599
Advances Secured by Real Estate, net (25) 220
Net Cash Used in Investing Activities (2,622) (2,271) (971)
Cash Flows from Financing Activities:
(Repayments) Issuance of Commercial Paper Obligations, net (246) 246 –
Proceeds from Long-Term Borrowings, net 522 –15
Repayments of Long-Term Debt (14) (8) (40)
Proceeds from Sale of Common Stock, net 267 167 122
Cash Dividends Paid to Stockholders (255) (168) (139)
Minority Interest Contributions to Partnership 711 10
Net Cash Provided by (Used in) Financing Activities 281 248 (32)
Effect of Exchange Rate Changes on Cash and Cash Equivalents 1(4) –
Increase (Decrease) in Cash and Cash Equivalents 106 (110) 26
Cash and Cash Equivalents at Beginning of Year 62 172 146
Cash and Cash Equivalents at End of Year $ 168 $ 62 $ 172
Supplemental Disclosure of Cash Payments Made for:
Interest, net of interest capitalized $26 $36 $42
Income Taxes $ 1,396 $ 940 $ 685
See accompanying notes to consolidated financial statements.
25