Home Depot 1999 Annual Report Download - page 24
Download and view the complete annual report
Please find page 24 of the 1999 Home Depot annual report below. You can navigate through the pages in the report by either clicking on the pages listed below, or by using the keyword search tool below to find specific information within the annual report.-
 1
1 -
2
-
3
-
4
-
5
-
6
-
7
-
8
-
9
-
10
-
11
-
12
-
13
-
 14
14 -
 15
15 -
 16
16 -
 17
17 -
 18
18 -
 19
19 -
 20
20 -
 21
21 -
 22
22 -
 23
23 -
 24
24 -
 25
25 -
 26
26 -
 27
27 -
 28
28 -
 29
29 -
 30
30 -
 31
31 -
 32
32 -
 33
33 -
 34
34 -
35
-
36
-
37
-
38
-
39
-
40
-
41
-
42
 |
 |

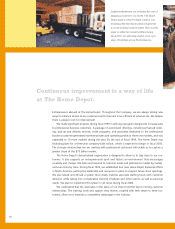
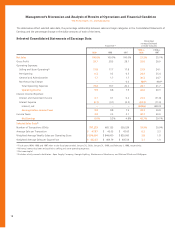
Management’s Discussion and Analysis of Results of Operations and Financial Condition (continued)
The Home Depot, Inc. and Subsidiaries
Fiscal year ended January 31, 1999 compared to
February 1, 1998
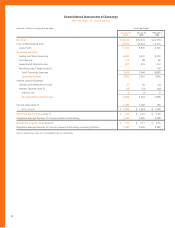
Net sales for fiscal 1998 increased 25.1% to $30.2 billion from
$24.2 billion in fiscal 1997. This increase was attributable to, among
other things, full year sales from the 112 new stores opened during
fiscal 1997, a 7% comparable store-for-store sales increase, and
138 new store openings and 4 store relocations during fiscal 1998.
One store opened during fiscal 1998 was subsequently closed during
the year and reopened during fiscal 1999.
Gross profit as a percent of sales was 28.5% for fiscal 1998
compared to 28.1% for fiscal 1997. The rate increase was primarily
attributable to a lower cost of merchandise resulting from product line
reviews and other merchandising initiatives begun in fiscal 1996 and
continued through fiscal 1997 and 1998. In addition, sales mix
changes, better inventory shrink results and benefits from import
strategies contributed to the overall gross profit improvement.
Operating expenses as a percent of sales were 19.7% for fiscal 1998
compared to 20.2% for fiscal 1997. Operating expenses for fiscal
1997 included a $104 million non-recurring charge related to the settle-
ments of a class action gender discrimination lawsuit and three other
gender discrimination lawsuits. Excluding the non-recurring charge,
operating expenses as a percent of sales were 19.8% for fiscal 1997.
Selling and store operating expenses as a percent of sales decreased
to 17.7% in fiscal 1998 from 17.8% in fiscal 1997. The decrease was
primarily attributable to lower net advertising expenses resulting from
higher cooperative advertising participation by vendors, increased use of
national advertising and leverage achieved from opening stores in
existing markets. In addition, improved claims management and focus
on safety programs resulted in lower workers’ compensation and
general liability claims experience as a percent of sales. Also, minority
interest decreased from fiscal 1997, mainly due to the purchase of
the remaining 25% of The Home Depot Canada partnership from
The Molson Companies during the first quarter of fiscal 1998. Partially
offsetting these decreases were higher medical costs from increased
family enrollment in the Company’s medical plans and higher store
selling payroll expenses as a percent of sales. The increase in store sell-
ing payroll expenses was primarily due to increased sales penetrations
in higher margin décor categories, which require more hours and
higher average pay rates to support. Overall productivity, in terms of
sales per labor hour, increased from fiscal 1997.
Pre-opening expenses as a percent of sales were 0.3% for both
fiscal 1998 and 1997. The Company opened 138 new stores and relo-
cated 4 stores in fiscal 1998, and opened 112 new stores and relocated
5 stores in fiscal 1997. Pre-opening expenses averaged $618,000 per
store in fiscal 1998 compared to $559,000 per store in fiscal 1997. The
higher average expense resulted primarily from the Company’s initial
entry into markets such as Chile, Puerto Rico and Alaska, which involve
longer pre-opening periods and higher travel and relocation costs.
General and administrative expenses as a percent of sales were
1.7% for both fiscal 1998 and 1997. Incremental expenses related to
long-term growth and business planning initiatives incurred in fiscal
1998 were offset by efficiencies realized from increased sales.
Interest and investment income as a percent of sales decreased to
0.1% in fiscal 1998 from 0.2% in fiscal 1997 due to lower investment
balances and lower interest rates. Interest expense as a percent
of sales was 0.1% in fiscal 1998 compared to 0.2% in fiscal 1997.
The decrease from fiscal 1997 was primarily attributable to economies
realized from a 25.1% increase in sales for fiscal 1998 and higher
capitalized interest resulting from a higher percentage of owned
stores under construction.
The Company’s combined federal and state effective income tax
rate was 39.2% for fiscal 1998 compared to 38.9% for fiscal 1997.
The increase was due to a reduction in tax-exempt interest income as
investment balances declined during the year and to higher effective
state tax rates.
Net earnings as a percent of sales were 5.3% for fiscal 1998
compared to 4.8% for fiscal 1997, reflecting a higher gross profit rate,
lower selling and store operating expenses as a percent of sales and
the non-recurring charge recorded in fiscal 1997. Diluted earnings per
share were $0.71 for fiscal 1998 compared to $0.52 for fiscal 1997.
Liquidity and Capital Resources
Cash flow generated from store operations provides the Company
with a significant source of liquidity. Additionally, a significant portion
of the Company’s inventory is financed under vendor credit terms.
The Company plans to open approximately 200 new stores and
relocate 6 existing stores during fiscal 2000. It is anticipated that
approximately 89% of these locations will be owned, and the
remainder will be leased. The Company also plans to open approxi-
mately 240 stores, including relocations, in fiscal 2001.
The Company has two operating lease agreements totaling
$882 million for the purpose of financing construction costs of certain
new stores. Under the operating lease agreements, the lessor
purchases the properties, pays for the construction costs and sub-
sequently leases the facilities to the Company. The leases provide for
substantial residual value guarantees and include purchase options at
original cost on each property. The Company financed a portion of its
new stores in fiscal 1997, 1998 and 1999, as well as an office building
in fiscal 1999, under the operating lease agreements and anticipates
utilizing these facilities to finance selected new stores and an office
building in fiscal 2000. In addition, some locations for fiscal 2000 will
be leased individually, and it is expected that many locations may be
obtained through the acquisition of land parcels and construction or
purchase of buildings.
20