Home Depot 1999 Annual Report Download - page 33
Download and view the complete annual report
Please find page 33 of the 1999 Home Depot annual report below. You can navigate through the pages in the report by either clicking on the pages listed below, or by using the keyword search tool below to find specific information within the annual report.-
 1
1 -
2
-
3
-
4
-
5
-
6
-
7
-
8
-
9
-
10
-
11
-
12
-
13
-
14
-
15
-
16
-
17
-
18
-
19
-
20
-
21
-
22
-
 23
23 -
 24
24 -
 25
25 -
 26
26 -
 27
27 -
 28
28 -
 29
29 -
 30
30 -
 31
31 -
 32
32 -
 33
33 -
 34
34 -
 35
35 -
 36
36 -
 37
37 -
 38
38 -
 39
39 -
 40
40 -
 41
41 -
 42
42
 |
 |

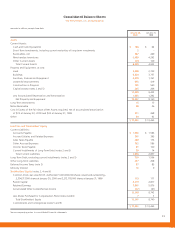
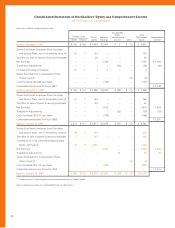
The Home Depot, Inc. and Subsidiaries
No valuation allowance was recorded against the deferred tax
assets at January 30, 2000 or January 31, 1999. Company manage-
ment believes the existing net deductible temporary differences
comprising the total gross deferred tax assets will reverse during periods
in which the Company generates net taxable income.
>Note 4
Employee Stock Plans
The 1997 Omnibus Stock Incentive Plan (“1997 Plan”) provides that
incentive stock options, non-qualified stock options, stock appreciation
rights, restricted stock and deferred shares may be issued to selected
associates, officers and directors of the Company. The maximum
number of shares of the Company’s common stock available for issu-
ance under the 1997 Plan is the lesser of 225 million shares or the
number of shares carried over from prior plans plus one-half percent of
the total number of outstanding shares as of the first day of each fiscal
year. In addition, restricted shares issued under the 1997 Plan may
not exceed 22.5 million shares. As of January 30, 2000, there were
128,623,884 shares available for future grants under the 1997 Plan.
Under the 1997 Plan and prior plans, incentive and non-qualified
options for 116,647,978 shares, net of cancellations (of which
48,228,638 had been exercised), have been granted at prices rang-
ing from $6.42 to $51.46 per share. Incentive stock options vest at
the rate of 25% per year commencing on the first anniversary date
of the grant and expire on the tenth anniversary date of the grant.
The non-qualified options have similar terms; however, vesting does
not generally begin until the second anniversary date of the grant.
As of January 30, 2000, 208,337 shares of restricted stock were
outstanding. The restricted shares vest over varying terms and are
generally based on the attainment of certain performance goals. The
expected fair value of the restricted shares on the vesting dates will be
charged to expense ratably over the vesting periods unless it is deter-
mined that the performance goals will not be met.
The per share weighted average fair value of stock options
granted during fiscal years 1999, 1998 and 1997 was $18.86, $9.94
and $4.20, respectively. These amounts were determined using the
Black-Scholes option-pricing model, which values options based on
the stock price at the grant date, the expected life of the option, the
estimated volatility of the stock, expected dividend payments, and the
risk-free interest rate over the expected life of the option. The dividend
yield was calculated by dividing the current annualized dividend by the
option price for each grant. Expected volatility was based on stock
prices for the fiscal year the grant occurred and the two previous fiscal
years. The risk-free interest rate was the rate available on zero coupon
U.S. government issues with a term equal to the remaining term for
each grant. The expected life of each option was estimated based on
the exercise history from previous grants.
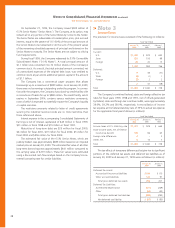
The assumptions used in the Black-Scholes model were as follows:
Stock Options
Granted in Fiscal Year
1999 1998 1997
Risk-free interest rate 5.1% 5.6% 6.1%
Expected volatility of common stock 51.6% 45.7% 30.0%
Dividend yield 0.3% 0.4% 0.5%
Expected option term 5 years 5 years 5 years
The Company applies APB No. 25 in accounting for its stock plans
and, accordingly, no compensation costs have been recognized in the
Company’s financial statements for incentive or non-qualified stock
options granted. If, under SFAS 123, the Company determined
compensation costs based on the fair value at the grant date for its
stock options, net earnings and earnings per share would have been
reduced to the pro forma amounts below (in millions, except per
share data):
Fiscal Year Ended
January 30, January 31, February 1,
2000 1999 1998
Net Earnings
As reported $ 2,320 $ 1,614 $ 1,160
Pro forma $ 2,186 $ 1,527 $ 1,118
Basic Earnings per Share
As reported $ 1.03 $ 0.73 $ 0.53
Pro forma $ 0.97 $ 0.69 $ 0.51
Diluted Earnings per Share
As reported $ 1.00 $ 0.71 $ 0.52
Pro forma $ 0.94 $ 0.67 $ 0.50
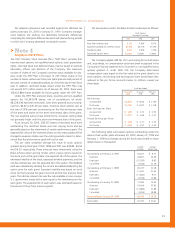
The following table summarizes options outstanding under the
various stock option plans at January 30, 2000, January 31, 1999 and
February 1, 1998 and changes during the fiscal years ended on these
dates (shares in thousands):
Number Average
of Shares Option Price
Outstanding at February 2, 1997 54,207 $ 8.77
Granted 25,857 14.58
Exercised (10,293) 8.82
Cancelled (4,044) 10.19
Outstanding at February 1, 1998 65,727 10.08
Granted 21,041 21.63
Exercised (11,640) 9.07
Cancelled (3,536) 13.89
Outstanding at January 31, 1999 71,592 13.45
Granted 14,006 37.81
Exercised (13,884) 10.88
Cancelled (3,295) 18.88
Outstanding at January 30, 2000
68,419 $ 18.79
Exercisable 22,330 $ 10.61
29