Home Depot 1999 Annual Report Download - page 4
Download and view the complete annual report
Please find page 4 of the 1999 Home Depot annual report below. You can navigate through the pages in the report by either clicking on the pages listed below, or by using the keyword search tool below to find specific information within the annual report.
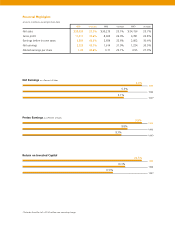
1999 Increase 1998 Increase 1997* Increase
Net sales $38,434 27.2% $30,219 25.1% $ 24,156 23.7%
Gross profit 11,411 32.6% 8,605 26.9% 6,781 24.8%
Earnings before income taxes 3,804 43.3% 2,654 32.6% 2,002 30.4%
Net earnings 2,320 43.7% 1,614 31.9% 1,224 30.5%
Diluted earnings per share 1.00 40.8% 0.71 29.1% 0.55 27.9%
Financial Highlights
Net Earnings as a Percent of Sales
6.0%
5.3%
5.1%
1999
1998
1997*
Pretax Earnings as a Percent of Sales
9.9%
8.8%
8.3%
1999
1998
1997*
Return on Invested Capital 22.5%
19.3%
17.0%
1999
1998
1997*
*Excludes the effect of a $104 million non-recurring charge.
amounts in millions, except per share data


