Home Depot 1999 Annual Report Download - page 28
Download and view the complete annual report
Please find page 28 of the 1999 Home Depot annual report below. You can navigate through the pages in the report by either clicking on the pages listed below, or by using the keyword search tool below to find specific information within the annual report.-
 1
1 -
2
-
3
-
4
-
5
-
6
-
7
-
8
-
9
-
10
-
11
-
12
-
13
-
14
-
15
-
16
-
17
-
 18
18 -
 19
19 -
 20
20 -
 21
21 -
 22
22 -
 23
23 -
 24
24 -
 25
25 -
 26
26 -
 27
27 -
 28
28 -
 29
29 -
 30
30 -
 31
31 -
 32
32 -
 33
33 -
 34
34 -
 35
35 -
 36
36 -
 37
37 -
 38
38 -
39
-
40
-
41
-
42
 |
 |

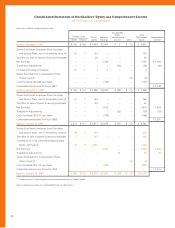
Consolidated Statements of Stockholders’ Equity and Comprehensive Income
The Home Depot, Inc. and Subsidiaries
amounts in millions, except per share data
Accumulated
Other Total
Common Stock Paid-In Retained Comprehensive Stockholders’ Comprehensive
Shares Amount Capital Earnings Income Other Equity Income(1)
Balance, February 2, 1997
2,163 $ 108 $ 2,439 $ 3,407 $ 2 $ (1) $ 5,955
Shares Sold Under Employee Stock Purchase
and Option Plans, net of retirements (note 4) 12 1 123 – – – 124
Tax Effect of Sale of Option Shares by Employees – – 26 – – – 26
Net Earnings – – – 1,160 – – 1,160 $ 1,160
Translation Adjustments – – – – (30) – (30) (30)
Immaterial Pooling of Interests 21 1 1 2 – – 4
Shares Purchased for Compensation Plans
(notes 4 and 6) – – – – – (2) (2)
Cash Dividends ($0.063 per share) – – – (139) – – (139)
Comprehensive Income for Fiscal 1997 $ 1,130
Balance, February 1, 1998
2,196 $ 110 $ 2,589 $ 4,430 $ (28) $ (3) $ 7,098
Shares Sold Under Employee Stock Purchase
and Option Plans, net of retirements (note 4) 17 1 165 – – – 166
Tax Effect of Sale of Option Shares by Employees – – 63 – – – 63
Net Earnings – – – 1,614 – – 1,614 1,614
Translation Adjustments – – – – (33) – (33) (33)
Cash Dividends ($0.077 per share) – – – (168) – – (168)
Comprehensive Income for Fiscal 1998 $ 1,581
Balance, January 31, 1999
2,213 $ 111 $ 2,817 $ 5,876 $ (61) $ (3) $ 8,740
Shares Sold Under Employee Stock Purchase
and Option Plans, net of retirements (note 4) 19 1 273 – – – 274
Tax Effect of Sale of Option Shares by Employees – – 132 – – – 132
Conversion of 31⁄4% Convertible Subordinated
Notes, net (note 2) 72 3 1,097 – – – 1,100
Net Earnings – – – 2,320 – – 2,320 2,320
Translation Adjustments –– – – 34 – 34 34
Shares Purchased for Compensation Plans
(notes 4 and 6) –– – – – (4) (4)
Cash Dividends ($0.113 per share) – – – (255) – – (255)
Comprehensive Income for Fiscal 1999 $ 2,354
Balance, January 30, 2000
2,304 $ 115 $ 4,319 $ 7,941 $ (27) $ (7) $ 12,341
(1) Components of comprehensive income are reported net of related taxes.
See accompanying notes to consolidated financial statements.
24