Home Depot 1999 Annual Report Download - page 26
Download and view the complete annual report
Please find page 26 of the 1999 Home Depot annual report below. You can navigate through the pages in the report by either clicking on the pages listed below, or by using the keyword search tool below to find specific information within the annual report.-
 1
1 -
2
-
3
-
4
-
5
-
6
-
7
-
8
-
9
-
10
-
11
-
12
-
13
-
14
-
15
-
 16
16 -
 17
17 -
 18
18 -
 19
19 -
 20
20 -
 21
21 -
 22
22 -
 23
23 -
 24
24 -
 25
25 -
 26
26 -
 27
27 -
 28
28 -
 29
29 -
 30
30 -
 31
31 -
 32
32 -
 33
33 -
 34
34 -
 35
35 -
 36
36 -
37
-
38
-
39
-
40
-
41
-
42
 |
 |

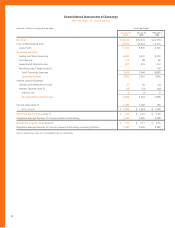
Consolidated Statements of Earnings
The Home Depot, Inc. and Subsidiaries
amounts in millions, except per share data Fiscal Year Ended
January 30, January 31, February 1,
2000 1999 1998
Net Sales
$ 38,434 $ 30,219 $ 24,156
Cost of Merchandise Sold 27,023 21,614 17,375
Gross Profit 11,411 8,605 6,781
Operating Expenses:
Selling and Store Operating 6,832 5,341 4,303
Pre-Opening 113 88 65
General and Administrative 671 515 413
Non-Recurring Charge (note 8) –– 104
Total Operating Expenses 7,616 5,944 4,885
Operating Income
3,795 2,661 1,896
Interest Income (Expense):
Interest and Investment Income 37 30 44
Interest Expense (note 2) (28) (37) (42)
Interest, net 9(7) 2
Earnings Before Income Taxes
3,804 2,654 1,898
Income Taxes (note 3) 1,484 1,040 738
Net Earnings
$ 2,320 $ 1,614 $ 1,160
Basic Earnings Per Share
(note 7) $1.03 $ 0.73 $ 0.53
Weighted Average Number of Common Shares Outstanding 2,244 2,206 2,188
Diluted Earnings Per Share
(note 7) $1.00 $ 0.71 $ 0.52
Weighted Average Number of Common Shares Outstanding Assuming Dilution 2,342 2,320 2,287
See accompanying notes to consolidated financial statements.
22