Enom 2015 Annual Report Download - page 99
Download and view the complete annual report
Please find page 99 of the 2015 Enom annual report below. You can navigate through the pages in the report by either clicking on the pages listed below, or by using the keyword search tool below to find specific information within the annual report.-
 1
1 -
2
-
3
-
4
-
5
-
6
-
7
-
8
-
9
-
10
-
11
-
12
-
13
-
14
-
15
-
16
-
17
-
18
-
19
-
20
-
21
-
22
-
23
-
24
-
25
-
26
-
27
-
28
-
29
-
30
-
31
-
32
-
33
-
34
-
35
-
36
-
37
-
38
-
39
-
40
-
41
-
42
-
43
-
44
-
45
-
46
-
47
-
48
-
49
-
50
-
51
-
52
-
53
-
54
-
55
-
56
-
57
-
58
-
59
-
60
-
61
-
62
-
63
-
64
-
65
-
66
-
67
-
68
-
69
-
70
-
71
-
72
-
73
-
74
-
75
-
76
-
77
-
78
-
79
-
80
-
81
-
82
-
83
-
84
-
85
-
86
-
87
-
88
-
 89
89 -
 90
90 -
 91
91 -
 92
92 -
 93
93 -
 94
94 -
 95
95 -
 96
96 -
 97
97 -
 98
98 -
 99
99 -
 100
100 -
 101
101 -
 102
102 -
 103
103 -
 104
104 -
 105
105 -
 106
106 -
 107
107 -
 108
108 -
 109
109 -
110
 |
 |

F-35
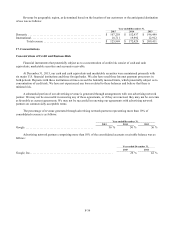
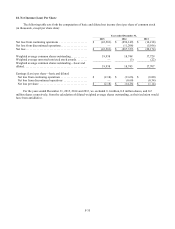
18. Net Income (Loss) Per Share
The following table sets forth the computation of basic and diluted net income (loss) per share of common stock
(in thousands, except per share data):
Year ended December 31,
2015
2014
2013
Net loss from continuing operations ....................
$
(43,501)
$
(256,149)
$
(14,218)
Net loss from discontinued operations ...................
—
(11,208)
(5,956)
Net loss ............................................
$
(43,501)
$
(267,357)
$
(20,174)
Weighted average common shares outstanding............
19,938
18,748
17,729
Weighted average unvested restricted stock awards ........
—
(3)
(22)
Weighted average common shares outstanding—basic and
diluted .............................................
19,938
18,745
17,707
Earnings (Loss) per share—basic and diluted
Net loss from continuing operations ...................
$
(2.18)
$
(13.66)
$
(0.80)
Net loss from discontinued operations .................
—
(0.60)
(0.34)
Net loss per share ..................................
$
(2.18)
$
(14.26)
$
(1.14)
For the years ended December 31, 2015, 2014 and 2013, we excluded 0.1 million, 0.2 million shares, and 0.2
million shares respectively, from the calculation of diluted weighted average shares outstanding, as their inclusion would
have been antidilutive.