Enom 2015 Annual Report Download - page 49
Download and view the complete annual report
Please find page 49 of the 2015 Enom annual report below. You can navigate through the pages in the report by either clicking on the pages listed below, or by using the keyword search tool below to find specific information within the annual report.-
 1
1 -
2
-
3
-
4
-
5
-
6
-
7
-
8
-
9
-
10
-
11
-
12
-
13
-
14
-
15
-
16
-
17
-
18
-
19
-
20
-
21
-
22
-
23
-
24
-
25
-
26
-
27
-
28
-
29
-
30
-
31
-
32
-
33
-
34
-
35
-
36
-
37
-
38
-
 39
39 -
 40
40 -
 41
41 -
 42
42 -
 43
43 -
 44
44 -
 45
45 -
 46
46 -
 47
47 -
 48
48 -
 49
49 -
 50
50 -
 51
51 -
 52
52 -
 53
53 -
 54
54 -
 55
55 -
 56
56 -
 57
57 -
 58
58 -
 59
59 -
60
-
61
-
62
-
63
-
64
-
65
-
66
-
67
-
68
-
69
-
70
-
71
-
72
-
73
-
74
-
75
-
76
-
77
-
78
-
79
-
80
-
81
-
82
-
83
-
84
-
85
-
86
-
87
-
88
-
89
-
90
-
91
-
92
-
93
-
94
-
95
-
96
-
97
-
98
-
99
-
100
-
101
-
102
-
103
-
104
-
105
-
106
-
107
-
108
-
109
-
110
 |
 |

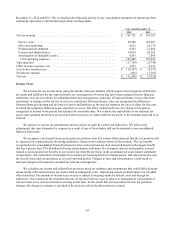
47
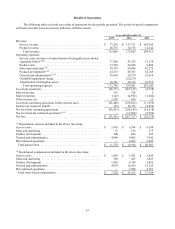
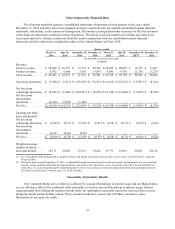
Results of Operations
The following tables set forth our results of operations for the periods presented. The period-to-period comparison
of financial results is not necessarily indicative of future results.
Year ended December 31,
2015
2014
2013
Revenue:
Service revenue ...........................................
$
77,254
$
137,711
$
195,269
Product revenue ...........................................
48,715
34,718
14,142
Total revenue ...........................................
125,969
172,429
209,411
Operating expenses:
Service costs (exclusive of amortization of intangible assets shown
separately below)(1)(2) .......................................
37,289
43,325
51,274
Product costs ..............................................
33,769
26,058
9,882
Sales and marketing(1)(2) .....................................
20,319
20,046
36,275
Product development(1)(2) ....................................
24,313
29,387
32,185
General and administrative(1)(2) ...............................
38,344
50,179
53,014
Goodwill impairment charge .................................
—
232,270
—
Amortization of intangible assets .............................
18,706
38,316
36,519
Total operating expenses .................................
172,740
439,581
219,149
Loss from operations ..........................................
(46,771)
(267,152)
(9,738)
Interest income ..............................................
361
328
5
Interest expense ..............................................
(143)
(4,692)
(1,642)
Other income, net ............................................
3,107
654
13
Loss from continuing operations before income taxes ...............
(43,446)
(270,862)
(11,362)
Income tax (expense) benefit ...................................
(55)
14,713
(2,856)
Net loss from continuing operations .............................
(43,501)
(256,149)
(14,218)
Net loss from discontinued operations(1)(2) ........................
—
(11,208)
(5,956)
Net loss .....................................................
$
(43,501)
$
(267,357)
$
(20,174)
(1) Depreciation expense included in the above line items:
Service costs ................................................
$
5,965
$
6,798
$
9,594
Sales and marketing ..........................................
67
156
275
Product development ..........................................
200
496
645
General and administrative .....................................
4,946
4,802
3,942
Discontinued operations .......................................
—
4,662
6,045
Total depreciation ...........................................
$
11,178
$
16,914
$
20,501
(2) Stock-based compensation included in the above line items:
Service costs ................................................
$
1,084
$
1,422
$
2,420
Sales and marketing ..........................................
588
683
3,823
Product development ..........................................
1,836
4,745
3,835
General and administrative .....................................
4,054
12,016
12,525
Discontinued operations .......................................
—
2,949
4,781
Total stock-based compensation ...............................
$
7,562
$
21,815
$
27,384