Enom 2015 Annual Report Download - page 55
Download and view the complete annual report
Please find page 55 of the 2015 Enom annual report below. You can navigate through the pages in the report by either clicking on the pages listed below, or by using the keyword search tool below to find specific information within the annual report.-
 1
1 -
2
-
3
-
4
-
5
-
6
-
7
-
8
-
9
-
10
-
11
-
12
-
13
-
14
-
15
-
16
-
17
-
18
-
19
-
20
-
21
-
22
-
23
-
24
-
25
-
26
-
27
-
28
-
29
-
30
-
31
-
32
-
33
-
34
-
35
-
36
-
37
-
38
-
39
-
40
-
41
-
42
-
43
-
44
-
 45
45 -
 46
46 -
 47
47 -
 48
48 -
 49
49 -
 50
50 -
 51
51 -
 52
52 -
 53
53 -
 54
54 -
 55
55 -
 56
56 -
 57
57 -
 58
58 -
 59
59 -
 60
60 -
 61
61 -
 62
62 -
 63
63 -
 64
64 -
 65
65 -
66
-
67
-
68
-
69
-
70
-
71
-
72
-
73
-
74
-
75
-
76
-
77
-
78
-
79
-
80
-
81
-
82
-
83
-
84
-
85
-
86
-
87
-
88
-
89
-
90
-
91
-
92
-
93
-
94
-
95
-
96
-
97
-
98
-
99
-
100
-
101
-
102
-
103
-
104
-
105
-
106
-
107
-
108
-
109
-
110
 |
 |

53
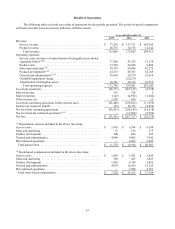
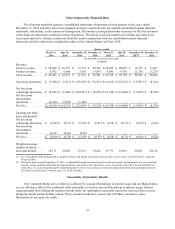
Selected Quarterly Financial Data
The following unaudited quarterly consolidated statements of operations for the quarters in the years ended
December 31, 2015 and 2014, have been prepared on a basis consistent with our audited consolidated annual financial
statements, and include, in the opinion of management, all normal recurring adjustments necessary for the fair statement
of the financial information contained in those statements. The period-to-period comparison of financial results is not
necessarily indicative of future results and should be read in conjunction with our consolidated annual financial
statements and the related notes included elsewhere in this Annual Report on Form 10-K.
Quarter ended
March 31,
June 30,
September 30,
December 31,
March 31,
June 30,
September 30,
December 31,
2014
2014
2014
2014
2015
2015
2015(2)
2015
(In thousands, except per share data)
Unaudited
Revenue:
Service revenue .....
$
38,264
$
36,397
$
33,712
$
29,338
$
23,225
$
20,067
$
16,755
$
17,207
Product revenue .....
6,792
6,680
7,603
13,643
9,985
9,701
11,750
17,279
Total revenue .......
$
45,056
$
43,077
$
41,315
$
42,981
$
33,210
$
29,768
$
28,505
$
34,486
Loss from operations .
$
(5,708)
$
(5,215)
$
(239,316)
$
(16,913)
$
(9,663)
$
(14,527)
$
(13,967)
$
(8,614)
Net loss from
continuing operations
$
(8,946)
$
(6,440)
$
(222,533)
$
(18,230)
$
(6,749)
$
(14,408)
$
(13,805)
$
(8,539)
Net loss from
discontinued
operations ..........
(2,010)
(7,892)
(1,306)
—
—
—
—
—
Net loss ............
$
(10,956)
$
(14,332)
$
(223,839)
$
(18,230)
$
(6,749)
$
(14,408)
$
(13,805)
$
(8,539)
Earnings per share -
basic and diluted
(1)
Net loss from
continuing operations
$
(0.49)
$
(0.35)
$
(11.62)
$
(0.93)
$
(0.34)
$
(0.73)
$
(0.69)
$
(0.42)
Net loss from
discontinued
operations ..........
(0.11)
(0.43)
(0.07)
—
—
—
—
—
Net loss ............
$
(0.60)
$
(0.78)
$
(11.69)
$
(0.93)
$
(0.34)
$
(0.73)
$
(0.69)
$
(0.42)
Weighted average
number of shares -
basic and diluted ....
18,171
18,286
19,151
19,622
19,773
19,841
20,021
20,114
(1) For a description of the method used to compute our basic and diluted net income (loss) per share, refer to note 7 in Part II, Item 6, “Selected
Financial Data.”
(2) During the quarter ended September 30, 2015, we identified through our internal processes that our property and equipment, net was overstated
because certain capitalized internally developed software costs had not been placed into service and certain write-offs were not identified on a
timely basis. As such, during the quarter ended September 30, 2015, we recorded an out of period adjustment which increased depreciation by
$0.6 million and decreased “Other income, net” by $0.5 million.
Seasonality of Quarterly Results
Our Content & Media service offering is affected by seasonal fluctuations in internet usage and our Marketplaces
service offering is affected by traditional retail seasonality as well as seasonal fluctuations in internet usage. Internet
usage generally slows during the summer months while our marketplaces generally experience increased sales activity
during the fourth quarter holiday season. These seasonal trends have caused, and will likely continue to cause,
fluctuations in our quarterly results.