Enom 2015 Annual Report Download - page 37
Download and view the complete annual report
Please find page 37 of the 2015 Enom annual report below. You can navigate through the pages in the report by either clicking on the pages listed below, or by using the keyword search tool below to find specific information within the annual report.-
 1
1 -
2
-
3
-
4
-
5
-
6
-
7
-
8
-
9
-
10
-
11
-
12
-
13
-
14
-
15
-
16
-
17
-
18
-
19
-
20
-
21
-
22
-
23
-
24
-
25
-
26
-
 27
27 -
 28
28 -
 29
29 -
 30
30 -
 31
31 -
 32
32 -
 33
33 -
 34
34 -
 35
35 -
 36
36 -
 37
37 -
 38
38 -
 39
39 -
 40
40 -
 41
41 -
 42
42 -
 43
43 -
 44
44 -
 45
45 -
 46
46 -
 47
47 -
48
-
49
-
50
-
51
-
52
-
53
-
54
-
55
-
56
-
57
-
58
-
59
-
60
-
61
-
62
-
63
-
64
-
65
-
66
-
67
-
68
-
69
-
70
-
71
-
72
-
73
-
74
-
75
-
76
-
77
-
78
-
79
-
80
-
81
-
82
-
83
-
84
-
85
-
86
-
87
-
88
-
89
-
90
-
91
-
92
-
93
-
94
-
95
-
96
-
97
-
98
-
99
-
100
-
101
-
102
-
103
-
104
-
105
-
106
-
107
-
108
-
109
-
110
 |
 |

35
comparable GAAP financial measures. Further, non-GAAP financial measures do not have standardized meanings, and
therefore other companies, including peer companies, may use the same or similarly named measures but exclude
different items or use different computations, so comparability may be limited. Non-GAAP financial measures should be
considered in addition to, and not as a substitute for, measures prepared in accordance with GAAP. We encourage
investors and others to review our financial information in its entirety and not rely on a single financial measure.
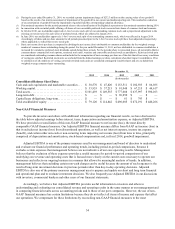
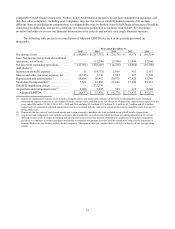
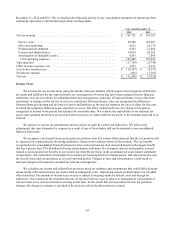
The following table presents a reconciliation of Adjusted EBITDA for each of the periods presented (in
thousands):
Year ended December 31,
2015
2014
2013
2012
2011
Net income (loss).......................
$
(43,501)
$
(267,357)
$
(20,174)
$
6,176
$
(18,524)
Less: Net income (loss) from discontinued
operations, net of taxes ..................
—
(11,208)
(5,956)
11,040
17,066
Net loss from continuing operations .......
(43,501)
(256,149)
(14,218)
(4,864)
(35,590)
Add (deduct):
Income tax (benefit) expense .............
55
(14,713)
2,856
951
2,181
Interest and other (income) expense, net ....
(3,325)
3,710
1,624
627
1,198
Depreciation and amortization(1) ..........
29,884
50,567
50,976
47,420
53,349
Stock-based compensation(2) .............
7,562
18,866
22,603
27,189
25,951
Goodwill impairment charge .............
—
232,270
—
—
—
Acquisition and realignment costs(3) .......
2,488
2,905
529
110
2,048
Adjusted EBITDA ...................
$
(6,837)
$
37,456
$
64,370
$
71,433
$
49,137
(1) Represents depreciation expense of our long-lived tangible assets and amortization expense of our finite-lived intangible assets, including
amortization expense related to our investment in media content assets, included in our GAAP results of operations. Amortization expense for the
years ended December 31, 2015, 2014, 2013, 2012 and 2011 includes $3.4 million, $7.7 million, $3.1 million, $2.1 million and $5.9 million,
respectively, of accelerated non-cash amortization expense associated with the removal of certain media content intangible assets from service
during those years.
(2) Represents the fair value of stock-based awards and certain warrants to purchase our stock included in our GAAP results of operations.
(3) Acquisition and realignment costs include such items, when applicable, as (a) non-cash GAAP purchase accounting adjustments for certain
deferred revenue costs, (b) legal, accounting and other professional service fees directly attributable to acquisition or corporate realignment
activities, (c) employee severance payments attributable to corporate realignment activities, and (d) expenditures related to the separation of
Demand Media into two distinct publicly traded companies. Management does not consider these costs to be indicative of our core operating
results.