Enom 2015 Annual Report Download - page 68
Download and view the complete annual report
Please find page 68 of the 2015 Enom annual report below. You can navigate through the pages in the report by either clicking on the pages listed below, or by using the keyword search tool below to find specific information within the annual report.-
 1
1 -
2
-
3
-
4
-
5
-
6
-
7
-
8
-
9
-
10
-
11
-
12
-
13
-
14
-
15
-
16
-
17
-
18
-
19
-
20
-
21
-
22
-
23
-
24
-
25
-
26
-
27
-
28
-
29
-
30
-
31
-
32
-
33
-
34
-
35
-
36
-
37
-
38
-
39
-
40
-
41
-
42
-
43
-
44
-
45
-
46
-
47
-
48
-
49
-
50
-
51
-
52
-
53
-
54
-
55
-
56
-
57
-
 58
58 -
 59
59 -
 60
60 -
 61
61 -
 62
62 -
 63
63 -
 64
64 -
 65
65 -
 66
66 -
 67
67 -
 68
68 -
 69
69 -
 70
70 -
 71
71 -
 72
72 -
 73
73 -
 74
74 -
 75
75 -
 76
76 -
 77
77 -
 78
78 -
79
-
80
-
81
-
82
-
83
-
84
-
85
-
86
-
87
-
88
-
89
-
90
-
91
-
92
-
93
-
94
-
95
-
96
-
97
-
98
-
99
-
100
-
101
-
102
-
103
-
104
-
105
-
106
-
107
-
108
-
109
-
110
 |
 |

F-4
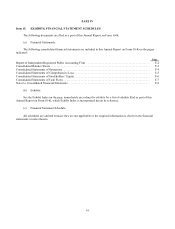
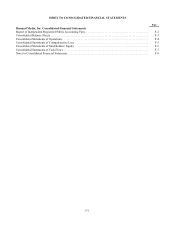
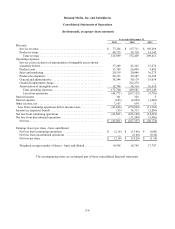
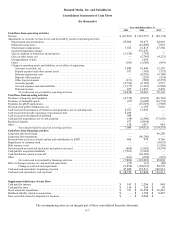
Demand Media, Inc. and Subsidiaries
Consolidated Statements of Operations
(In thousands, except per share amounts)
Year ended December 31,
2015
2014
2013
Revenue:
Service revenue ..............................................
$
77,254
$
137,711
$
195,269
Product revenue .............................................
48,715
34,718
14,142
Total revenue .............................................
125,969
172,429
209,411
Operating expenses:
Service costs (exclusive of amortization of intangible assets shown
separately below) ............................................
37,289
43,325
51,274
Product costs ................................................
33,769
26,058
9,882
Sales and marketing ..........................................
20,319
20,046
36,275
Product development .........................................
24,313
29,387
32,185
General and administrative ....................................
38,344
50,179
53,014
Goodwill impairment charge ...................................
—
232,270
—
Amortization of intangible assets ...............................
18,706
38,316
36,519
Total operating expenses ....................................
172,740
439,581
219,149
Loss from operations .......................................
(46,771)
(267,152)
(9,738)
Interest income ................................................
361
328
5
Interest expense ................................................
(143)
(4,692)
(1,642)
Other income, net ..............................................
3,107
654
13
Loss from continuing operations before income taxes ................
(43,446)
(270,862)
(11,362)
Income tax (expense) benefit .....................................
(55)
14,713
(2,856)
Net loss from continuing operations ...............................
(43,501)
(256,149)
(14,218)
Net loss from discontinued operations ..............................
—
(11,208)
(5,956)
Net loss ....................................................
$
(43,501)
$
(267,357)
$
(20,174)
Earnings (Loss) per share - basic and diluted
Net loss from continuing operations .............................
$
(2.18)
$
(13.66)
$
(0.80)
Net loss from discontinued operations ...........................
—
(0.60)
(0.34)
Net loss per share ............................................
$
(2.18)
$
(14.26)
$
(1.14)
Weighted average number of shares - basic and diluted .............
19,938
18,745
17,707
The accompanying notes are an integral part of these consolidated financial statements.