Enom 2015 Annual Report Download - page 35
Download and view the complete annual report
Please find page 35 of the 2015 Enom annual report below. You can navigate through the pages in the report by either clicking on the pages listed below, or by using the keyword search tool below to find specific information within the annual report.-
 1
1 -
2
-
3
-
4
-
5
-
6
-
7
-
8
-
9
-
10
-
11
-
12
-
13
-
14
-
15
-
16
-
17
-
18
-
19
-
20
-
21
-
22
-
23
-
24
-
 25
25 -
 26
26 -
 27
27 -
 28
28 -
 29
29 -
 30
30 -
 31
31 -
 32
32 -
 33
33 -
 34
34 -
 35
35 -
 36
36 -
 37
37 -
 38
38 -
 39
39 -
 40
40 -
 41
41 -
 42
42 -
 43
43 -
 44
44 -
 45
45 -
46
-
47
-
48
-
49
-
50
-
51
-
52
-
53
-
54
-
55
-
56
-
57
-
58
-
59
-
60
-
61
-
62
-
63
-
64
-
65
-
66
-
67
-
68
-
69
-
70
-
71
-
72
-
73
-
74
-
75
-
76
-
77
-
78
-
79
-
80
-
81
-
82
-
83
-
84
-
85
-
86
-
87
-
88
-
89
-
90
-
91
-
92
-
93
-
94
-
95
-
96
-
97
-
98
-
99
-
100
-
101
-
102
-
103
-
104
-
105
-
106
-
107
-
108
-
109
-
110
 |
 |

33
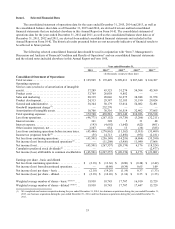
Item 6. Selected Financial Data
The consolidated statement of operations data for the years ended December 31, 2015, 2014 and 2013, as well as
the consolidated balance sheet data as of December 31, 2015 and 2014, are derived from our audited consolidated
financial statements that are included elsewhere in this Annual Report on Form 10-K. The consolidated statement of
operations data for the years ended December 31, 2012 and 2011, as well as the consolidated balance sheet data as of
December 31, 2013, 2012 and 2011, are derived from audited consolidated financial statements not included in this
Annual Report on Form 10-K. The historical results presented below are not necessarily indicative of financial results to
be achieved in future periods.
The following selected consolidated financial data should be read in conjunction with “Item 7. Management’s
Discussion and Analysis of Financial Condition and Results of Operations” and our consolidated financial statements
and the related notes included elsewhere in this Annual Report on Form 10-K.
Year ended December 31,
2015
2014(1)
2013(1)
2012(1)
2011(1)
(In thousands, except per share data)
Consolidated Statement of Operations:
Total revenue ..................................
$
125,969
$
172,429
$
209,411
$
207,640
$
164,307
Operating expenses:
Service costs (exclusive of amortization of intangible
assets) ........................................
37,289
43,325
51,274
54,304
45,360
Product costs ..................................
33,769
26,058
9,882
—
—
Sales and marketing ............................
20,319
20,046
36,275
38,948
31,978
Product development ............................
24,313
29,387
32,185
31,190
29,024
General and administrative .......................
38,344
50,179
53,014
54,082
52,491
Goodwill impairment charge(2) ....................
—
232,270
—
—
—
Amortization of intangible assets ..................
18,706
38,316
36,519
32,402
37,665
Total operating expenses ........................
172,740
439,581
219,149
210,926
196,518
Loss from operations ............................
(46,771)
(267,152)
(9,738)
(3,286)
(32,211)
Interest income ................................
361
328
5
31
48
Interest expense ................................
(143)
(4,692)
(1,642)
(622)
(861)
Other income (expense), net ......................
3,107
654
13
(36)
(385)
Loss from continuing operations before income taxes .
(43,446)
(270,862)
(11,362)
(3,913)
(33,409)
Income tax (expense) benefit(2) ...................
(55)
14,713
(2,856)
(951)
(2,181)
Net loss from continuing operations ...............
(43,501)
(256,149)
(14,218)
(4,864)
(35,590)
Net income (loss) from discontinued operations(3) ....
—
(11,208)
(5,956)
11,040
17,066
Net income (loss)...............................
(43,501)
(267,357)
(20,174)
6,176
(18,524)
Cumulative preferred stock dividends(4) ............
—
—
—
—
(2,477)
Net income (loss) attributable to common stockholders
$
(43,501)
$
(267,357)
$
(20,174)
$
6,176
$
(21,001)
Earnings per share - basic and diluted
Net loss from continuing operations ...............
$
(2.18)
$
(13.66)
$
(0.80)
$
(0.28)
$
(2.42)
Net income (loss) from discontinued operations ......
—
(0.60)
(0.34)
0.65
1.09
Net income (loss) per share - basic ................
(2.18)
(14.26)
(1.14)
0.37
(1.33)
Net income (loss) per share - diluted ...............
$
(2.18)
$
(14.26)
$
(1.14)
$
0.35
$
(1.33)
Weighted average number of shares - basic (5)(6)(7) ....
19,938
18,745
17,707
16,910
15,729
Weighted average number of shares - diluted (5)(6)(7) ...
19,938
18,745
17,707
17,447
15,729
(1) We completed one business acquisition during the year ended December 31, 2014, two business acquisitions during the year ended December 31,
2013, one business acquisition during the year ended December 31, 2012, and four business acquisitions during the year ended December 31,
2011.