Energizer 2004 Annual Report Download - page 44
Download and view the complete annual report
Please find page 44 of the 2004 Energizer annual report below. You can navigate through the pages in the report by either clicking on the pages listed below, or by using the keyword search tool below to find specific information within the annual report.-
 1
1 -
2
-
3
-
4
-
5
-
6
-
7
-
8
-
9
-
10
-
11
-
12
-
13
-
14
-
15
-
16
-
17
-
18
-
19
-
20
-
21
-
22
-
23
-
24
-
25
-
26
-
27
-
28
-
29
-
30
-
31
-
32
-
33
-
 34
34 -
 35
35 -
 36
36 -
 37
37 -
 38
38 -
 39
39 -
 40
40 -
 41
41 -
 42
42 -
 43
43 -
 44
44 -
 45
45 -
 46
46 -
 47
47
 |
 |

ENR 2004 Annual Report
42
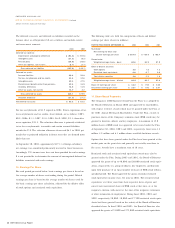
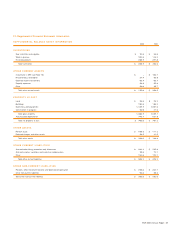
ALLOWANCE FOR DOUBTFUL ACCOUNTS
2004 2003 2002
Balance at beginning of year $ 9.8 $ 6.9 $ 11.8
Acquisition of SWS –2.0 –
Provision charged to expense 3.4 3.7 16.6
Write-offs, less recoveries (2.5) (4.4) (21.2)
SPE (see Note 15) 4.3 1.6 (0.3)
Balance at end of year $ 15.0 $ 9.8 $ 6.9
SUPPLEMENTAL CASH FLOW STATEMENT INFORMATION
2004 2003 2002
Interest paid $ 32.0 $ 31.6 $ 19.9
Income taxes paid 72.9 75.6 95.7
ENERGI ZER HOLDINGS, INC.
NOTES TO CONSOLIDATED FINANCI AL STATEMENTS Continued
(Dollars in millions, except per share data)
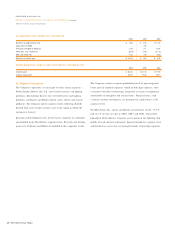
22. Segment Information
The Company’s operations are managed via three major segments –
North America Battery (the U.S. and Canada batteries and lighting
products), International Battery (rest of world battery and lighting
products) and Razors and Blades (global razors, blades and related
products). The Company reports segment results reflecting all profit
derived from each outside customer sale in the region in which the
customer is located.
Research and development costs for the battery segments are combined
and included in the Total Battery segment results. Research and develop-
ment costs for Razors and Blades are included in that segment’s results.
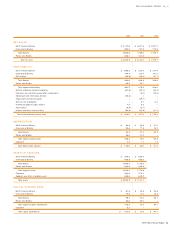
The Company evaluates segment profitability based on operating profit
before general corporate expenses, which include legal expenses, costs
associated with most restructuring, integration or business realignment,
amortization of intangibles and unusual items. Financial items, such
as interest income and expense, are managed on a global basis at the
corporate level.
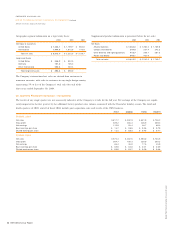
Wal-Mart Stores, Inc. and its subsidiaries accounted for 16.6%, 15.8%
and 16.3% of total net sales in 2004, 2003 and 2002, respectively,
primarily in North America. Corporate assets shown in the following table
include all cash and cash equivalents, financial instruments, pension assets
and deferred tax assets that are managed outside of operating segments.