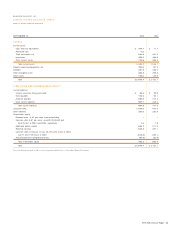
Energizer 2004 Annual Report Download - page 17
Download and view the complete annual report
Please find page 17 of the 2004 Energizer annual report below. You can navigate through the pages in the report by either clicking on the pages listed below, or by using the keyword search tool below to find specific information within the annual report.-
 1
1 -
2
-
3
-
4
-
5
-
6
-
 7
7 -
 8
8 -
 9
9 -
 10
10 -
 11
11 -
 12
12 -
 13
13 -
 14
14 -
 15
15 -
 16
16 -
 17
17 -
 18
18 -
 19
19 -
 20
20 -
 21
21 -
 22
22 -
 23
23 -
 24
24 -
 25
25 -
 26
26 -
 27
27 -
28
-
29
-
30
-
31
-
32
-
33
-
34
-
35
-
36
-
37
-
38
-
39
-
40
-
41
-
42
-
43
-
44
-
45
-
46
-
47
 |
 |

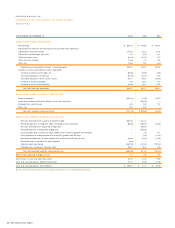
Liquidity and Capital Resources
In 2004, cash flow from operations totaled $485.7, an increase of
$43.6 from 2003. The increase is due to higher “operating cash flow
before changes in working capital” of $164.5, partially offset by lower
conversion of working capital items to cash. The 2003 cash flow
reflects an unusually large change in inventory balance as described
below, accounting for the decline in 2004.
Cash flow from operations totaled $442.1 in 2003, an increase of $236.0
from 2002 operating cash flows of $206.1. The increase is due to cash
generated from working capital changes of $201.9 compared to cash
outflows for working capital in 2002 of $53.7, partially offset by lower
cash flow from earnings before working capital changes. The most signifi-
cant working capital changes were: 1) a $148.0 reduction in inventory,
reflecting the conversion of high cost acquired SWS inventory to lower cost
SWS inventory manufactured after acquisition as well as other inventory
reductions; and 2) a $136.2 cash flow improvement in other current
assets, primarily related to the level of sales of accounts receivable by the
Company’s non-consolidated SPE; partially offset by 3) unfavorable cash
flow from increases in accounts receivable in 2003. Cash flow from oper-
ations before changes in working capital were $240.2 in 2003 compared
to $259.8 in 2002. The decrease was mainly due to lower net earnings
caused by the $58.3 after-tax SWS inventory write-up discussed previously,
partially offset by higher earnings for the remainder of the business.
Working capital was $468.8 and $515.6 at September 30, 2004 and
2003, respectively. Working capital components were influenced by the
special purpose entity accounting previously discussed, but with no net
impact on total working capital. Apart from such accounting impact,
working capital changes reflect higher cash and accounts receivable,
more than offset by higher other accrued liabilities. Capital expenditures
totaled $121.4, $73.0 and $40.7 in 2004, 2003 and 2002, respec-
tively. These expenditures were funded by cash flow from operations.
Capital expenditures increased in 2004 as a result of increases for bat-
tery production projects, inclusion of SWS for a full year and corporate
expenditures. The increase in 2003 is primarily attributable to the SWS
acquisition. See Note 22 of the Consolidated Financial Statements for
capital expenditures by segment. Capital expenditures of approximately
$112.0 are anticipated in 2005. Such expenditures are expected to be
financed with funds generated from operations.
Total long-term debt outstanding, including current maturities,
was $1,079.6 at September 30, 2003. The Company maintains total
committed debt facilities of $1,239.0, of which $155.8 remained
available as of September 30, 2004.
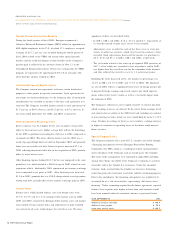
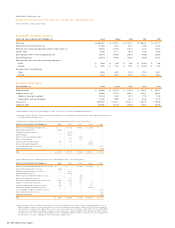
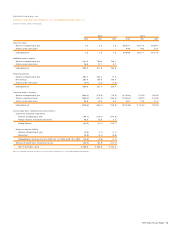
A summary of the Company’s significant contractual obligations at
September 30, 2004 is shown below. See Note 20 to the Consolidated
Financial Statements for discussion of loan guarantees.
LESS MORE
THAN 1-3 3-5 THAN 5
TOTAL 1 YEAR YEARS YEARS YEARS
Long-term debt,
including current
maturities $ 1,079.6 $ 20.0 $ 354.6 $ 135.0 $ 570.0
Notes payable 162.3 162.3–––
Operating leases 67.0 15.7 22.5 16.5 12.3
Total $ 1,308.9 $ 198.0 $ 377.1 $ 151.5 $ 582.3
In November 2004, the Company entered into two new financing agree-
ments. A $300.0 long-term debt financing was completed, with maturities
of three, five and seven years and with fixed rates ranging from 3.44% to
4.38%. Proceeds from these notes were used to pay down all existing long-
term debt in the revolving credit facility and to partially retire short-term debt
within the secured financing. In addition, the Company renegotiated its
existing revolving credit facility in order to extend the maturity to five
years and to realize more favorable borrowing spreads. As a result of the
new financing arrangement, available committed debt facilities increased by
$300.0 to $1,539.0.
Under the terms of the Company’s debt facilities, the ratio of the Company’s
total indebtedness to its Earnings Before Interest, Taxes, Depreciation and
Amortization (EBITDA) (as defined by the facility agreement and pro forma
in the current year) cannot be greater than 3.5 to 1, and the ratio of its
current year pro forma EBIT to total interest expense must exceed 3 to 1.
The Company’s ratio of total indebtedness to its pro forma EBITDA was
2.4 to 1, and the ratio of its pro forma EBIT to total interest expense was
13.0 to 1 as of September 30, 2004. Additional restrictive covenants
exist under current debt facilities. Failure to comply with the above
ratios or other covenants could result in acceleration of maturity, which
could trigger cross defaults on other borrowings. The Company believes
that covenant violations resulting in acceleration of maturity is unlikely.
The Company’s fixed rate debt is callable by the Company, subject to a
“make whole” premium, which would be required to the extent the under-
lying benchmark U.S. treasury yield has declined since issuance.
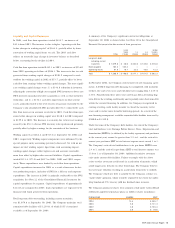
The Company purchased shares of its common stock under various Board
of Director approved repurchase plans as follows (shares in millions):
FI SCAL YEAR SHARES COST
2004 13.4 $ 546.7
2003 5.0 $ 131.4
2002 3.8 $ 103.3
2001 3.8 $ 79.6
ENR 2004 Annual Report 15