Energizer 2004 Annual Report Download - page 12
Download and view the complete annual report
Please find page 12 of the 2004 Energizer annual report below. You can navigate through the pages in the report by either clicking on the pages listed below, or by using the keyword search tool below to find specific information within the annual report.-
 1
1 -
 2
2 -
 3
3 -
 4
4 -
 5
5 -
 6
6 -
 7
7 -
 8
8 -
 9
9 -
 10
10 -
 11
11 -
 12
12 -
 13
13 -
 14
14 -
 15
15 -
 16
16 -
 17
17 -
 18
18 -
 19
19 -
 20
20 -
 21
21 -
 22
22 -
23
-
24
-
25
-
26
-
27
-
28
-
29
-
30
-
31
-
32
-
33
-
34
-
35
-
36
-
37
-
38
-
39
-
40
-
41
-
42
-
43
-
44
-
45
-
46
-
47
 |
 |

ENR 2004 Annual Report
10
The following discussion is a summary of the key factors management
considers necessary in reviewing Energizer Holdings, Inc.’s (the
Company) historical basis results of operations, operating segment
results, and liquidity and capital resources. The Company includes the
battery business (Energizer) and the razors and blades business (Schick-
Wilkinson Sword, or SWS). This discussion should be read in conjunction
with the Consolidated Financial Statements and related notes.
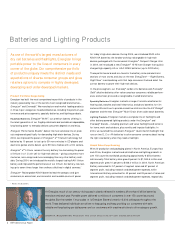
Battery Business Overview
Energizer is one of the world’s largest manufacturers and marketers of
batteries and flashlights, with a complete line of household batteries
including alkaline, carbon zinc and lithium as well as specialty miniature,
rechargeable and photo batteries. Its two primary brands are Energizer
and Eveready, which are well known throughout the world.
There has been a continuing shift in consumer preference from carbon
zinc batteries to higher-power, higher-priced alkaline and other more
advanced batteries. Alkaline batteries are the predominant primary bat-
tery in most parts of the world except Asia and Africa. However, carbon
zinc batteries continue to play a major role in less developed countries
throughout the world and offer Energizer market position in those coun-
tries. Energizer uses its full portfolio of products to meet consumer needs.
Energizer operates 20 manufacturing and packaging facilities in 14
countries on four continents. Its products are marketed and sold in more
than 150 countries primarily through a direct sales force, and also
through distributors and wholesalers.
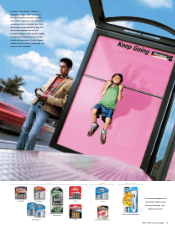
The battery category continues to be highly competitive as manufacturer
and retailer brands compete for consumer acceptance and retail shelf
space. Overall household battery consumption is increasing, but category
value growth in the United States (U.S.) has lagged unit sales as consumer
purchases have shifted to larger pack sizes and price-oriented brands
have grown faster than premium products. Retail outlets experiencing
the strongest battery category growth in the U.S. include mass mer-
chandisers’ super center format, home centers and dollar stores, while
traditional outlets such as food, drug and hardware declined. Wal-Mart
Stores, Inc. and its subsidiaries is Energizer’s largest customer. Energizer
is well positioned to meet the needs of customer and consumer demands
in these formats, leveraging category expertise, retail understanding and
its portfolio of products to give Energizer a strong presence in each of the
retail channels. Energizer estimates its share of the total U.S. retail alkaline
market was approximately 31% in 2004 and 2003, and 32% in 2002.
Internationally, economic conditions and currency valuations relative to
the U.S. dollar have improved in 2004 and in 2003, resulting in
improved International Battery segment results. The strengthening of the
euro and certain key currencies in the Asia Pacific region have been a
significant benefit to Energizer in 2004 and 2003. A significant portion
of Energizer’s product cost is more closely tied to the U.S. dollar than to
the local currencies in which the product is sold. As such, currencies
strengthening relative to the U.S. dollar improve margins as product
costs in local currency terms decline. Conversely, weakening currencies
relative to the U.S. dollar can be significantly unfavorable unless mitigated
through pricing actions. Changes in the value of local currencies will
continue to impact segment profitability in the future.
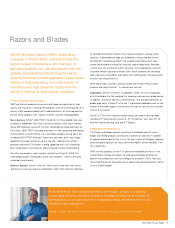
Razors and Blades Business Overview
On March 28, 2003, the Company acquired the worldwide SWS
business from Pfizer, Inc. SWS is the second largest manufacturer and
marketer of men’s and women’s wet shave products in the world. SWS
operates five manufacturing facilities worldwide, and its products are
marketed in over 100 countries. Its primary markets are the U.S.,
Canada, Japan and the larger countries of Western Europe. SWS
estimates its overall share of the wet shave category for these major
markets at approximately 22% in 2004 and 19% in 2003.
The Company views the wet shave products category as attractive within
the consumer products industry due to the limited number of manufactur-
ers, the high degree of consumer loyalty and the ability to improve pricing
through innovation. While the category is extremely competitive for retail
shelf space and product innovation, SWS has high-quality products and
believes it has the opportunity to grow sales and margins in the future.
The SWS business is compatible with Energizer’s business in terms of
common customers, distribution channels and geographic presence,
providing opportunities to leverage the Company’s marketing expertise,
business organization and scale globally.
Beginning in 2003, SWS launched two major new products. The Intuition
women’s shaving system was launched in the U.S. in April 2003 and in
other major world markets throughout 2004. QUATTRO was launched
in the U.S. and parts of Europe in September 2003, and was rolled out
to other markets later in 2004. Intuition Cucumber Melon was introduced
in the spring of 2004 and QUATTRO Midnight in September 2004. The
QUATTRO and Intuition brands represent more than a quarter of a billion
dollars of SWS global sales in 2004.
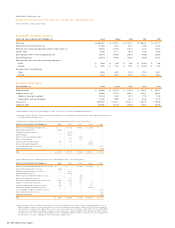
Highlights
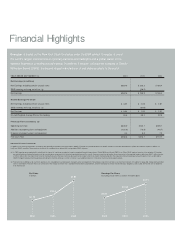
Net earnings for the year ended September 30, 2004 were $267.4
compared to $169.9 in 2003 and $186.4 in 2002. Basic and diluted
earnings per share in 2004 were $3.32 and $3.21, respectively,
compared to $1.98 and $1.93 in 2003 and $2.05 and $2.01 in 2002.
ENERGI ZER HOLDINGS, INC.
MANAGEMENT’S DISCUSSION AND ANALYSIS OF RESULTS OF OPERATIONS AND FINANCIAL CONDITION
(Dollars in millions, except per share and percentage data)