Energizer 2004 Annual Report Download - page 34
Download and view the complete annual report
Please find page 34 of the 2004 Energizer annual report below. You can navigate through the pages in the report by either clicking on the pages listed below, or by using the keyword search tool below to find specific information within the annual report.-
 1
1 -
2
-
3
-
4
-
5
-
6
-
7
-
8
-
9
-
10
-
11
-
12
-
13
-
14
-
15
-
16
-
17
-
18
-
19
-
20
-
21
-
22
-
23
-
 24
24 -
 25
25 -
 26
26 -
 27
27 -
 28
28 -
 29
29 -
 30
30 -
 31
31 -
 32
32 -
 33
33 -
 34
34 -
 35
35 -
 36
36 -
 37
37 -
 38
38 -
 39
39 -
 40
40 -
 41
41 -
 42
42 -
 43
43 -
 44
44 -
45
-
46
-
47
 |
 |

ENR 2004 Annual Report
32
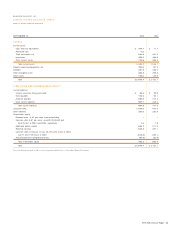
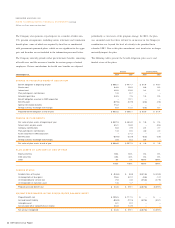
The deferred tax assets and deferred tax liabilities recorded on the
balance sheet as of September 30 are as follows and include current
and non-current amounts:
2004 2003
Deferred tax liabilities:
Depreciation and property differences $ (93.0) $ (92.6)
Intangible assets (31.2) (8.2)
Pension plans (38.6) (36.6)
Other tax liabilities, non-current (5.1) (2.7)
Gross deferred tax liabilities (167.9) (140.1)
Deferred tax assets:
Accrued liabilities 99.4 93.8
Tax loss carryforwards and tax credits 33.4 32.6
Intangible assets 42.3 47.5
Postretirement benefits other than pensions 32.4 33.9
Inventory differences 16.9 13.9
Other tax assets, non-current 14.7 8.2
Gross deferred tax assets 239.1 229.9
Valuation allowance (21.0) (27.3)
Net deferred tax assets $ 50.2 $ 62.5
Tax loss carryforwards of $2.9 expired in 2004. Future expirations of tax
loss carryforwards and tax credits, if not utilized, are as follows: 2005,
$0.9; 2006, $1.1; 2007, $1.8; 2008, $6.0; 2009, $2.1; thereafter
or no expiration, $21.5. The valuation allowance is primarily attributed
to tax loss carryforwards, tax credits and certain accrued liabilities
outside the U.S. The valuation allowance decreased $6.3 in 2004 pri-
marily due to projected utilization in future years that are deemed more
likely than not.
At September 30, 2004, approximately $273.1 of foreign subsidiary
net earnings was considered permanently invested in those businesses.
Accordingly, U.S. income taxes have not been provided for such earnings.
It is not practicable to determine the amount of unrecognized deferred tax
liabilities associated with such earnings.
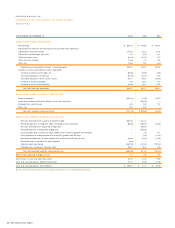
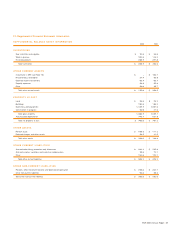
10. Earnings Per Share
For each period presented below, basic earnings per share is based on
the average number of shares outstanding during the period. Diluted
earnings per share is based on the average number of shares used for
the basic earnings per share calculation, adjusted for the dilutive effect
of stock options and restricted stock equivalents.
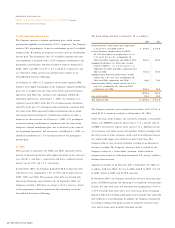
The following table sets forth the computation of basic and diluted
earnings per share (shares in millions):
FOR THE YEAR ENDED SEPTEMBER 30, 2004 2003 2002
Numerator:
Net earnings for basic and
dilutive earnings per share $ 267.4 $ 169.9 $ 186.4
Denominator:
Weighted-average shares - basic 80.6 85.9 91.0
Effect of dilutive securities
Stock options 2.0 1.6 1.2
Restricted stock equivalents 0.8 0.7 0.6
Total dilutive securities 2.8 2.3 1.8
Weighted-average shares - diluted 83.4 88.2 92.8
Basic net earnings per share $ 3.32 $ 1.98 $ 2.05
Diluted net earnings per share $ 3.21 $ 1.93 $ 2.01
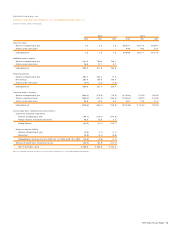
11. Share-Based Payments
The Company’s 2000 Incentive Stock Plan (the Plan) was adopted by
the Board of Directors in March 2000 and approved by shareholders,
with respect to future awards which may be granted under the Plan, at
the 2001 Annual Meeting of Shareholders. Under the Plan, awards to
purchase shares of the Company’s common stock (ENR stock) may be
granted to directors, officers and key employees. A maximum of 15.0
million shares of ENR stock was approved to be issued under the Plan.
At September 30, 2004, 2003 and 2002, respectively, there were 4.2
million, 4.9 million and 6.1 million shares available for future awards.
Options that have been granted under the Plan have been granted at the
market price on the grant date and generally vest ratably over three to
five years. Awards have a maximum term of 10 years.
Restricted stock and restricted stock equivalent awards may also be
granted under the Plan. During 2003 and 2002, the Board of Directors
approved the grants of up to 40,000 and 20,000 restricted stock equiv-
alents, respectively, to a group of officers, key employees and directors
upon their purchase of an equal number of shares of ENR stock within a
specified period. The Board approved the grants of similar restricted
stock equivalents in prior years, but none in 2004. The restricted stock
equivalents vest three years from their respective dates of grant and
convert into unrestricted shares of ENR stock at that time, or, at the
recipient’s election, will convert at the time of the recipient’s retirement
or other termination of employment. During fiscal 2004, 2003 and
2002, respectively, 20,000, 10,000 and 37,700 restricted stock equiv-
alents had been granted based on the activity of the Board of Directors
described above. In fiscal 2004 and 2003, the Board of Directors also
approved the grants of 74,000 and 272,000 restricted stock equivalents,
ENERGI ZER HOLDINGS, INC.
NOTES TO CONSOLIDATED FINANCI AL STATEMENTS Continued
(Dollars in millions, except per share data)