Energizer 2004 Annual Report Download - page 13
Download and view the complete annual report
Please find page 13 of the 2004 Energizer annual report below. You can navigate through the pages in the report by either clicking on the pages listed below, or by using the keyword search tool below to find specific information within the annual report.-
 1
1 -
2
-
 3
3 -
 4
4 -
 5
5 -
 6
6 -
 7
7 -
 8
8 -
 9
9 -
 10
10 -
 11
11 -
 12
12 -
 13
13 -
 14
14 -
 15
15 -
 16
16 -
 17
17 -
 18
18 -
 19
19 -
 20
20 -
 21
21 -
 22
22 -
 23
23 -
24
-
25
-
26
-
27
-
28
-
29
-
30
-
31
-
32
-
33
-
34
-
35
-
36
-
37
-
38
-
39
-
40
-
41
-
42
-
43
-
44
-
45
-
46
-
47
 |
 |

ENR 2004 Annual Report 11
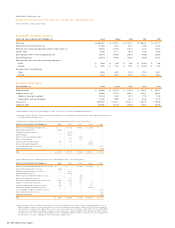
Current year net earnings include the following items, stated on an
after-tax basis: income tax benefits related to prior year losses and
adjustments to prior year tax accruals of $24.7 and special termination
pension benefits of $9.6. Fiscal 2003 net earnings included the following
on an after-tax basis: expense associated with the write-up of inventory
purchased in the SWS acquisition (SWS inventory write-up) of $58.3, a
charge of early payment of long-term debt of $12.4, gain on the sale of
property of $5.7, intellectual property rights income of $5.2 and tax
benefits of $19.2 related to prior year losses and adjustments to prior
year tax accruals. Fiscal 2002 net earnings included the following after-
tax items: accounts receivable write-off associated with the bankruptcy of
Kmart of $9.3, provisions for restructuring and related costs of $7.8, tax
benefits related to prior year losses and adjustments to prior year tax
accruals of $11.8 and a gain on the sale of property of $5.0.
Operating Results
Net Sales
Net sales increased $580.2, or 26%, in 2004 compared to 2003 and
increased $492.8, or 28%, in 2003 compared to 2002, primarily because
the inclusion of SWS sales for a full year in 2004 and six months in 2003
following the midyear acquisition. Battery sales increased $145.1 in 2004
on higher volume and favorable currency translation impacts of $59.3.
Battery sales increased $59.8 in 2003 compared to 2002 on favorable
currency translation, and volume increases contributed $35.7 and $33.7,
respectively, partially offset by unfavorable pricing and product mix.
Gross Margin
Gross margin dollars increased $450.4 in 2004 and $182.4 in 2003,
primarily due to the SWS acquisition. Gross margin percentage was 50.1%
of sales in 2004 compared to 42.9% in 2003, the latter percentage
including a four percentage point reduction due to expense related to the
SWS inventory write-up (see Note 3 to the Consolidated Financial
Statements). Absent the SWS inventory write-up, gross margin for 2003
would have been 46.9% compared to 44.6% in 2002. The increase in
gross margin percentage in both years is primarily due to the relatively
higher margins of the SWS business versus the battery business. See
Segment Results for a discussion of gross margin in each operating segment.
Selling, General and Administrative
Selling, general and administrative expense (SG&A) increased $159.3
in 2004 and $68.1 in 2003 primarily due to the SWS acquisition.
Additionally, the 2004 increase reflects the impact of higher currency
rates of $21.9, special termination benefits of $15.2 and higher
battery overhead spending of $14.6. Selling, general and administrative
expenses were 19.3%, 17.1% and 18.1% of sales in 2004, 2003 and
2002, respectively. The increased percentage in 2004 is primarily due
to special termination benefits discussed above, higher legal expenses
and integration associated with the SWS acquisition, and the inclusion
of SWS for a full year, which has a higher SG&A percentage than the
rate for the remainder of the Company.
Advertising and Promotion
Advertising and promotion (A&P) expense increased $152.3 in 2004
and $126.5 in 2003, compared to the year immediately preceding.
The A&P expense change in 2004 and 2003 above would have
decreased by $56.6 and $57.2, respectively, had SWS been included in
2003 and 2002. The remainder of the increases reflects significantly
higher SWS spending, currency translation impacts, increases in the
International Battery segment and, in 2004, an increase in North
America Battery. A&P expense was 14.3%, 11.2% and 7.2% of sales
for 2004, 2003 and 2002, respectively. Had SWS been included for
the full year in 2003 and 2002, such percentages would have been
12.1% and 10.1% for 2003 and 2002, respectively. The increased
percentages in 2004 and 2003 reflect the factors discussed above, as
well as the increased proportion of razor and blade sales, which have
a generally higher A&P percentage than the battery business.
Research and Development
Research and development expense was $74.0 in 2004, $51.5 in 2003
and $37.1 in 2002. The increase in 2004 and 2003 is primarily due to
the SWS acquisition. Additionally, the 2004 increase includes a $4.2
asset impairment charge related to a discontinued technology develop-
ment initiative. As a percent of sales, research and development expense
was 2.6% in 2004, 2.3% in 2003 and 2.1% in 2002. Inclusion of SWS
results for a full year in 2003 and 2002 would have resulted in research
and development expense of 2.6% and 2.7%, respectively, of sales.
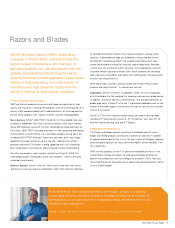
Segment Results
The Company’s operations are managed via three major segments – North
America Battery (the U.S. and Canada batteries and lighting products),
International Battery (rest of world battery and lighting products) and
Razors and Blades (global razors, blades and related products). The
Company reports segment results reflecting all profit derived from each
outside customer sale in the region in which the customer is located.
Research and development costs for the battery segments are combined
and included in the Total Battery segment results. Research and develop-
ment costs for Razors and Blades are included in that segment’s results.
This structure is the basis for the Company’s reportable operating
segment information presented in Note 22 to the Consolidated Financial