Dish Network 2013 Annual Report Download - page 86
Download and view the complete annual report
Please find page 86 of the 2013 Dish Network annual report below. You can navigate through the pages in the report by either clicking on the pages listed below, or by using the keyword search tool below to find specific information within the annual report.-
 1
1 -
2
-
3
-
4
-
5
-
6
-
7
-
8
-
9
-
10
-
11
-
12
-
13
-
14
-
15
-
16
-
17
-
18
-
19
-
20
-
21
-
22
-
23
-
24
-
25
-
26
-
27
-
28
-
29
-
30
-
31
-
32
-
33
-
34
-
35
-
36
-
37
-
38
-
39
-
40
-
41
-
42
-
43
-
44
-
45
-
46
-
47
-
48
-
49
-
50
-
51
-
52
-
53
-
54
-
55
-
56
-
57
-
58
-
59
-
60
-
61
-
62
-
63
-
64
-
65
-
66
-
67
-
68
-
69
-
70
-
71
-
72
-
73
-
74
-
75
-
 76
76 -
 77
77 -
 78
78 -
 79
79 -
 80
80 -
 81
81 -
 82
82 -
 83
83 -
 84
84 -
 85
85 -
 86
86 -
 87
87 -
 88
88 -
 89
89 -
 90
90 -
 91
91 -
 92
92 -
 93
93 -
 94
94 -
 95
95 -
 96
96 -
97
-
98
-
99
-
100
-
101
-
102
-
103
-
104
-
105
-
106
-
107
-
108
-
109
-
110
-
111
-
112
-
113
-
114
-
115
-
116
-
117
-
118
-
119
-
120
-
121
-
122
-
123
-
124
-
125
-
126
-
127
-
128
-
129
-
130
-
131
-
132
-
133
-
134
-
135
-
136
-
137
-
138
-
139
-
140
-
141
-
142
-
143
-
144
-
145
-
146
-
147
-
148
-
149
-
150
-
151
-
152
-
153
-
154
-
155
-
156
-
157
-
158
-
159
-
160
-
161
-
162
-
163
-
164
-
165
-
166
-
167
-
168
-
169
-
170
-
171
-
172
-
173
-
174
-
175
-
176
-
177
-
178
-
179
-
180
-
181
-
182
-
183
-
184
-
185
-
186
-
187
-
188
-
189
-
190
-
191
-
192
 |
 |

Item 7. MANAGEMENT’S DISCUSSION AND ANALYSIS OF FINANCIAL CONDITION AND
RESULTS OF OPERATIONS - Continued
76
76
Other, net. “Other, net” income totaled $174 million during the year ended December 31, 2012, an increase of $165
million compared to the same period in 2011. This change primarily resulted from a $99 million non-cash gain related
to the conversion of our DBSD North America 7.5% Convertible Senior Secured Notes due 2009 in connection with
the completion of the DBSD Transaction during the first quarter 2012 and an increase in net gains on the sale of
marketable investment securities of $96 million, partially offset by an increase in impairment charges of $32 million
during 2012. See Note 6 in the Notes to the Consolidated Financial Statements in Item 15 of this Annual Report on
Form 10-K for further information.
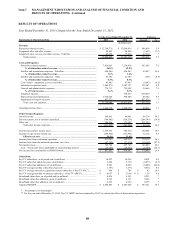
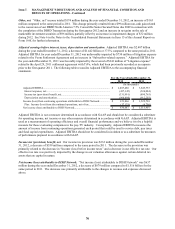
Adjusted earnings before interest, taxes, depreciation and amortization. Adjusted EBITDA was $2.407 billion
during the year ended December 31, 2012, a decrease of $1.442 billion or 37.5% compared to the same period in 2011.
Adjusted EBITDA for year ended December 31, 2012 was unfavorably impacted by $730 million of litigation expense
related to the Voom Settlement Agreement and an increase in “Subscriber-related expense.” Adjusted EBITDA for
the year ended December 31, 2011 was favorably impacted by the reversal of $341 million of “Litigation expense”
related to the April 29, 2011 settlement agreement with TiVo, which had been previously recorded as an expense
prior to the first quarter 2011. The following table reconciles Adjusted EBITDA to the accompanying financial
statements.
2012 2011
Adjusted EBITDA................................................................................................... 2,407,486$ 3,849,755$
Interest expense, net............................................................................................... (437,145) (524,084)
Income tax (provision) benefit, net........................................................................ (331,991) (890,765)
Depreciation and amortization............................................................................... (964,484) (912,203)
Income (loss) from continuing operations attributable to DISH Network............... 673,866$ 1,522,703$
Plus: Income (loss) from discontinued operations, net of tax............................... (37,179) (6,796)
Net income (loss) attributable to DISH Network..................................................... 636,687$ 1,515,907$
For the Years Ended December 31,
(In thousands)
Adjusted EBITDA is not a measure determined in accordance with GAAP and should not be considered a substitute
for operating income, net income or any other measure determined in accordance with GAAP. Adjusted EBITDA is
used as a measurement of operating efficiency and overall financial performance and we believe it to be a helpful
measure for those evaluating companies in the pay-TV industry. Conceptually, Adjusted EBITDA measures the
amount of income from continuing operations generated each period that could be used to service debt, pay taxes
and fund capital expenditures. Adjusted EBITDA should not be considered in isolation or as a substitute for measures
of performance prepared in accordance with GAAP.
Income tax (provision) benefit, net. Our income tax provision was $332 million during the year ended December
31, 2012, a decrease of $559 million compared to the same period in 2011. The decrease in the provision was
primarily related to the decrease in “Income (loss) before income taxes” and a decrease in our effective tax rate. Our
effective tax rate was positively impacted by the change in our valuation allowances against certain deferred tax
assets that are capital in nature.
Net income (loss) attributable to DISH Network. “Net income (loss) attributable to DISH Network” was $637
million during the year ended December 31, 2012, a decrease of $879 million compared to $1.516 billion for the
same period in 2011. The decrease was primarily attributable to the changes in revenue and expenses discussed
above.