Dish Network 2013 Annual Report Download - page 119
Download and view the complete annual report
Please find page 119 of the 2013 Dish Network annual report below. You can navigate through the pages in the report by either clicking on the pages listed below, or by using the keyword search tool below to find specific information within the annual report.-
 1
1 -
2
-
3
-
4
-
5
-
6
-
7
-
8
-
9
-
10
-
11
-
12
-
13
-
14
-
15
-
16
-
17
-
18
-
19
-
20
-
21
-
22
-
23
-
24
-
25
-
26
-
27
-
28
-
29
-
30
-
31
-
32
-
33
-
34
-
35
-
36
-
37
-
38
-
39
-
40
-
41
-
42
-
43
-
44
-
45
-
46
-
47
-
48
-
49
-
50
-
51
-
52
-
53
-
54
-
55
-
56
-
57
-
58
-
59
-
60
-
61
-
62
-
63
-
64
-
65
-
66
-
67
-
68
-
69
-
70
-
71
-
72
-
73
-
74
-
75
-
76
-
77
-
78
-
79
-
80
-
81
-
82
-
83
-
84
-
85
-
86
-
87
-
88
-
89
-
90
-
91
-
92
-
93
-
94
-
95
-
96
-
97
-
98
-
99
-
100
-
101
-
102
-
103
-
104
-
105
-
106
-
107
-
108
-
 109
109 -
 110
110 -
 111
111 -
 112
112 -
 113
113 -
 114
114 -
 115
115 -
 116
116 -
 117
117 -
 118
118 -
 119
119 -
 120
120 -
 121
121 -
 122
122 -
 123
123 -
 124
124 -
 125
125 -
 126
126 -
 127
127 -
 128
128 -
 129
129 -
130
-
131
-
132
-
133
-
134
-
135
-
136
-
137
-
138
-
139
-
140
-
141
-
142
-
143
-
144
-
145
-
146
-
147
-
148
-
149
-
150
-
151
-
152
-
153
-
154
-
155
-
156
-
157
-
158
-
159
-
160
-
161
-
162
-
163
-
164
-
165
-
166
-
167
-
168
-
169
-
170
-
171
-
172
-
173
-
174
-
175
-
176
-
177
-
178
-
179
-
180
-
181
-
182
-
183
-
184
-
185
-
186
-
187
-
188
-
189
-
190
-
191
-
192
 |
 |

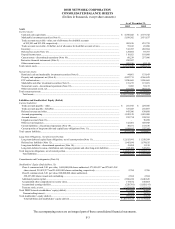
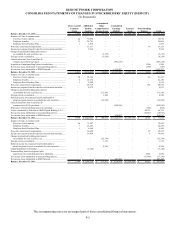
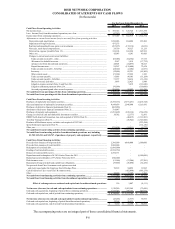
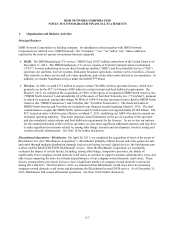
DISH NETWORK CORPORATION
NOTES TO CONSOLIDATED FINANCIAL STATEMENTS - Continued
F-9
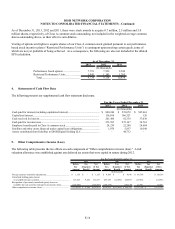
classified as available for sale are reflected in “Other, net” in the Consolidated Statements of Operations and
Comprehensive Income (Loss).
We evaluate our marketable investment securities portfolio on a quarterly basis to determine whether declines in the
fair value of these securities are other-than-temporary. This quarterly evaluation consists of reviewing, among other
things:
x the fair value of our marketable investment securities compared to the carrying amount,
x the historical volatility of the price of each security, and
x any market and company specific factors related to each security.
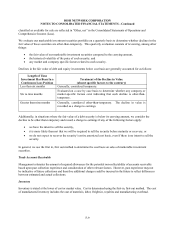
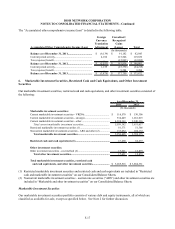
Declines in the fair value of debt and equity investments below cost basis are generally accounted for as follows:
Length of Time
Investment Has Been In a
Continuous Loss Position
Treatment of the Decline in Value
(absent specific factors to the contrary)
Less than six months Generally, considered temporary.
Six to nine months
Evaluated on a case by case basis to determine whether any company or
market-specific factors exist indicating that such decline is other-than-
temporary.
Greater than nine months Generally, considered other-than-temporary. The decline in value is
recorded as a charge to earnings.
Additionally, in situations where the fair value of a debt security is below its carrying amount, we consider the
decline to be other-than-temporary and record a charge to earnings if any of the following factors apply:
x we have the intent to sell the security,
x it is more likely than not that we will be required to sell the security before maturity or recovery, or
x we do not expect to recover the security’s entire amortized cost basis, even if there is no intent to sell the
security.
In general, we use the first in, first out method to determine the cost basis on sales of marketable investment
securities.
Trade Accounts Receivable
Management estimates the amount of required allowances for the potential non-collectability of accounts receivable
based upon past collection experience and consideration of other relevant factors. However, past experience may not
be indicative of future collections and therefore additional charges could be incurred in the future to reflect differences
between estimated and actual collections.
Inventory
Inventory is stated at the lower of cost or market value. Cost is determined using the first-in, first-out method. The cost
of manufactured inventory includes the cost of materials, labor, freight-in, royalties and manufacturing overhead.