Dish Network 2013 Annual Report Download - page 82
Download and view the complete annual report
Please find page 82 of the 2013 Dish Network annual report below. You can navigate through the pages in the report by either clicking on the pages listed below, or by using the keyword search tool below to find specific information within the annual report.-
 1
1 -
2
-
3
-
4
-
5
-
6
-
7
-
8
-
9
-
10
-
11
-
12
-
13
-
14
-
15
-
16
-
17
-
18
-
19
-
20
-
21
-
22
-
23
-
24
-
25
-
26
-
27
-
28
-
29
-
30
-
31
-
32
-
33
-
34
-
35
-
36
-
37
-
38
-
39
-
40
-
41
-
42
-
43
-
44
-
45
-
46
-
47
-
48
-
49
-
50
-
51
-
52
-
53
-
54
-
55
-
56
-
57
-
58
-
59
-
60
-
61
-
62
-
63
-
64
-
65
-
66
-
67
-
68
-
69
-
70
-
71
-
 72
72 -
 73
73 -
 74
74 -
 75
75 -
 76
76 -
 77
77 -
 78
78 -
 79
79 -
 80
80 -
 81
81 -
 82
82 -
 83
83 -
 84
84 -
 85
85 -
 86
86 -
 87
87 -
 88
88 -
 89
89 -
 90
90 -
 91
91 -
 92
92 -
93
-
94
-
95
-
96
-
97
-
98
-
99
-
100
-
101
-
102
-
103
-
104
-
105
-
106
-
107
-
108
-
109
-
110
-
111
-
112
-
113
-
114
-
115
-
116
-
117
-
118
-
119
-
120
-
121
-
122
-
123
-
124
-
125
-
126
-
127
-
128
-
129
-
130
-
131
-
132
-
133
-
134
-
135
-
136
-
137
-
138
-
139
-
140
-
141
-
142
-
143
-
144
-
145
-
146
-
147
-
148
-
149
-
150
-
151
-
152
-
153
-
154
-
155
-
156
-
157
-
158
-
159
-
160
-
161
-
162
-
163
-
164
-
165
-
166
-
167
-
168
-
169
-
170
-
171
-
172
-
173
-
174
-
175
-
176
-
177
-
178
-
179
-
180
-
181
-
182
-
183
-
184
-
185
-
186
-
187
-
188
-
189
-
190
-
191
-
192
 |
 |

Item 7. MANAGEMENT’S DISCUSSION AND ANALYSIS OF FINANCIAL CONDITION AND
RESULTS OF OPERATIONS - Continued
72
72
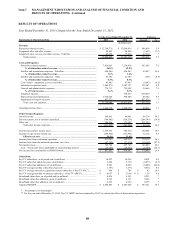
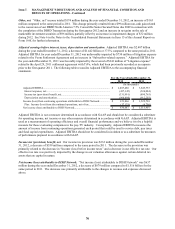
Adjusted earnings before interest, taxes, depreciation and amortization. Adjusted EBITDA was $2.805 billion
during the year ended December 31, 2013, an increase of $397 million or 16.5% compared to the same period in 2012.
Adjusted EBITDA for the year ended December 31, 2013 was negatively impacted by the $438 million impairment
charge for the T2 and D1 satellites during the second quarter 2013. The year ended December 31, 2012 was
negatively impacted by $730 million of “Litigation expense” related to the Voom Settlement Agreement. The
following table reconciles Adjusted EBITDA to the accompanying financial statements.
2013 2012
Adjusted EBITDA................................................................................................... 2,804,807$ 2,407,486$
Interest expense, net............................................................................................... (596,120) (437,145)
Income tax (provision) benefit, net........................................................................ (299,826) (331,991)
Depreciation and amortization............................................................................... (1,054,026) (964,484)
Income (loss) from continuing operations attributable to DISH Network............... 854,835$ 673,866$
Plus: Income (loss) from discontinued operations, net of tax............................... (47,343) (37,179)
Net income (loss) attributable to DISH Network..................................................... 807,492$ 636,687$
For the Years Ended December 31,
(In thousands)
Adjusted EBITDA is not a measure determined in accordance with accounting principles generally accepted in the
United States (“GAAP”) and should not be considered a substitute for operating income, net income or any other
measure determined in accordance with GAAP. Adjusted EBITDA is used as a measurement of operating
efficiency and overall financial performance and we believe it to be a helpful measure for those evaluating
companies in the pay-TV industry. Conceptually, Adjusted EBITDA measures the amount of income from
continuing operations generated each period that could be used to service debt, pay taxes and fund capital
expenditures. Adjusted EBITDA should not be considered in isolation or as a substitute for measures of performance
prepared in accordance with GAAP.
Income tax (provision) benefit, net. Our income tax provision was $300 million during the year ended December
31, 2013, a decrease of $32 million compared to the same period in 2012. The decrease in the provision was
primarily related to a decrease in our effective tax rate, partially offset by the increase in “Income (loss) before
income taxes.” Our effective tax rate was favorably impacted by the $102 million reversal of an uncertain tax
position that was resolved during the third quarter 2013.
Net income (loss) attributable to DISH Network. “Net income (loss) attributable to DISH Network” was $807
million during the year ended December 31, 2013, an increase of $170 million compared to $637 million for the
same period in 2012. This increase was primarily attributable to the changes in revenue and expenses discussed
above.