Dish Network 2013 Annual Report Download - page 84
Download and view the complete annual report
Please find page 84 of the 2013 Dish Network annual report below. You can navigate through the pages in the report by either clicking on the pages listed below, or by using the keyword search tool below to find specific information within the annual report.-
 1
1 -
2
-
3
-
4
-
5
-
6
-
7
-
8
-
9
-
10
-
11
-
12
-
13
-
14
-
15
-
16
-
17
-
18
-
19
-
20
-
21
-
22
-
23
-
24
-
25
-
26
-
27
-
28
-
29
-
30
-
31
-
32
-
33
-
34
-
35
-
36
-
37
-
38
-
39
-
40
-
41
-
42
-
43
-
44
-
45
-
46
-
47
-
48
-
49
-
50
-
51
-
52
-
53
-
54
-
55
-
56
-
57
-
58
-
59
-
60
-
61
-
62
-
63
-
64
-
65
-
66
-
67
-
68
-
69
-
70
-
71
-
72
-
73
-
 74
74 -
 75
75 -
 76
76 -
 77
77 -
 78
78 -
 79
79 -
 80
80 -
 81
81 -
 82
82 -
 83
83 -
 84
84 -
 85
85 -
 86
86 -
 87
87 -
 88
88 -
 89
89 -
 90
90 -
 91
91 -
 92
92 -
 93
93 -
 94
94 -
95
-
96
-
97
-
98
-
99
-
100
-
101
-
102
-
103
-
104
-
105
-
106
-
107
-
108
-
109
-
110
-
111
-
112
-
113
-
114
-
115
-
116
-
117
-
118
-
119
-
120
-
121
-
122
-
123
-
124
-
125
-
126
-
127
-
128
-
129
-
130
-
131
-
132
-
133
-
134
-
135
-
136
-
137
-
138
-
139
-
140
-
141
-
142
-
143
-
144
-
145
-
146
-
147
-
148
-
149
-
150
-
151
-
152
-
153
-
154
-
155
-
156
-
157
-
158
-
159
-
160
-
161
-
162
-
163
-
164
-
165
-
166
-
167
-
168
-
169
-
170
-
171
-
172
-
173
-
174
-
175
-
176
-
177
-
178
-
179
-
180
-
181
-
182
-
183
-
184
-
185
-
186
-
187
-
188
-
189
-
190
-
191
-
192
 |
 |
Item 7. MANAGEMENT’S DISCUSSION AND ANALYSIS OF FINANCIAL CONDITION AND
RESULTS OF OPERATIONS - Continued
74
74
Pay-TV subscribers. DISH added approximately 89,000 net Pay-TV subscribers during the year ended December
31, 2012, compared to a loss of approximately 166,000 net Pay-TV subscribers during the same period in 2011. The
increase versus the same period in 2011 primarily resulted from a decrease in our average monthly Pay-TV churn
rate and higher gross new Pay-TV subscriber activations due primarily to increased advertising associated with our
Hopper set-top box. During the year ended December 31, 2012, DISH activated approximately 2.739 million gross
new Pay-TV subscribers compared to approximately 2.576 million gross new Pay-TV subscribers during the same
period in 2011, an increase of 6.3%.
Our gross new Pay-TV subscriber activations continued to be negatively impacted by increased competitive
pressures, including aggressive marketing and discounted promotional offers. Telecommunications companies
continued to grow their pay-TV customer bases. In addition, our gross new Pay-TV subscriber activations
continued to be adversely affected by sustained economic weakness and uncertainty.
Our average monthly Pay-TV churn rate for the year ended December 31, 2012 was 1.57% compared to 1.63% for
the same period in 2011. Our Pay-TV churn rate was positively impacted in part because we did not have a
programming package price increase in the first quarter 2012, but did during the same period in 2011. While Pay-
TV churn improved compared to the same period in 2011, churn continued to be adversely affected by the increased
competitive pressures discussed above. Our Pay-TV churn rate was also impacted by, among other things, the credit
quality of previously acquired subscribers, our ability to consistently provide outstanding customer service, the
aggressiveness of competitor subscriber acquisition efforts, and our ability to control piracy and other forms of
fraud.
Broadband subscribers. DISH added approximately 78,000 net Broadband subscribers during the year ended
December 31, 2012, compared to a loss of approximately 5,000 net Broadband subscribers during the same period in
2011. This increase versus the same period in 2011 primarily resulted from higher gross new Broadband subscriber
activations driven by increased advertising associated with the launch of dishNET branded broadband services on
September 27, 2012. During the year ended December 31, 2012, DISH activated approximately 121,000 gross new
Broadband subscribers compared to approximately 30,000 gross new Broadband subscribers during the same period
in 2011.
The pace of net broadband subscriber activations increased in the fourth quarter primarily driven by increased
advertising associated with the launch of dishNET branded broadband services. Of the 2012 net broadband
subscriber activations, 34,000 occurred during the nine months ended September 30, 2012 and 44,000 occurred
during the three months ended December 31, 2012.
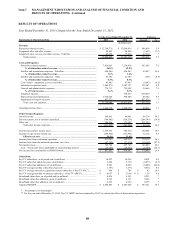
Subscriber-related revenue. “Subscriber-related revenue” totaled $13.065 billion for the year ended December 31,
2012, an increase of $93 million or 0.7% compared to the same period in 2011. The change in “Subscriber-related
revenue” from the previous year was primarily related to the increase in Pay-TV ARPU discussed below. Included
in “Subscriber-related revenue” was $95 million and $81 million of revenue related to our broadband services for the
years ended December 31, 2012 and 2011, respectively.
Pay-TV ARPU. “Pay-TV average monthly revenue per subscriber” was $76.98 during the year ended December 31,
2012 versus $76.43 during the same period in 2011. The $0.55 or 0.7% increase in Pay-TV ARPU was primarily
attributable to higher hardware related revenue.
Subscriber-related expenses. “Subscriber-related expenses” totaled $7.254 billion during the year ended December
31, 2012, an increase of $409 million or 6.0% compared to the same period in 2011. The increase in “Subscriber-
related expenses” was primarily attributable to higher programming costs. The increase in programming costs was
driven by rate increases in certain of our programming contracts, including the renewal of certain contracts at higher
rates. Included in “Subscriber-related expenses” was $51 million and $33 million of expense related to our broadband
services for the years ended December 31, 2012 and 2011, respectively. “Subscriber-related expenses” represented
55.5% and 52.8% of “Subscriber-related revenue” during the years ended December 31, 2012 and 2011, respectively.
The change in this expense to revenue ratio primarily resulted from higher programming costs, discussed above.