Dish Network 2013 Annual Report Download - page 67
Download and view the complete annual report
Please find page 67 of the 2013 Dish Network annual report below. You can navigate through the pages in the report by either clicking on the pages listed below, or by using the keyword search tool below to find specific information within the annual report.-
 1
1 -
2
-
3
-
4
-
5
-
6
-
7
-
8
-
9
-
10
-
11
-
12
-
13
-
14
-
15
-
16
-
17
-
18
-
19
-
20
-
21
-
22
-
23
-
24
-
25
-
26
-
27
-
28
-
29
-
30
-
31
-
32
-
33
-
34
-
35
-
36
-
37
-
38
-
39
-
40
-
41
-
42
-
43
-
44
-
45
-
46
-
47
-
48
-
49
-
50
-
51
-
52
-
53
-
54
-
55
-
56
-
 57
57 -
 58
58 -
 59
59 -
 60
60 -
 61
61 -
 62
62 -
 63
63 -
 64
64 -
 65
65 -
 66
66 -
 67
67 -
 68
68 -
 69
69 -
 70
70 -
 71
71 -
 72
72 -
 73
73 -
 74
74 -
 75
75 -
 76
76 -
 77
77 -
78
-
79
-
80
-
81
-
82
-
83
-
84
-
85
-
86
-
87
-
88
-
89
-
90
-
91
-
92
-
93
-
94
-
95
-
96
-
97
-
98
-
99
-
100
-
101
-
102
-
103
-
104
-
105
-
106
-
107
-
108
-
109
-
110
-
111
-
112
-
113
-
114
-
115
-
116
-
117
-
118
-
119
-
120
-
121
-
122
-
123
-
124
-
125
-
126
-
127
-
128
-
129
-
130
-
131
-
132
-
133
-
134
-
135
-
136
-
137
-
138
-
139
-
140
-
141
-
142
-
143
-
144
-
145
-
146
-
147
-
148
-
149
-
150
-
151
-
152
-
153
-
154
-
155
-
156
-
157
-
158
-
159
-
160
-
161
-
162
-
163
-
164
-
165
-
166
-
167
-
168
-
169
-
170
-
171
-
172
-
173
-
174
-
175
-
176
-
177
-
178
-
179
-
180
-
181
-
182
-
183
-
184
-
185
-
186
-
187
-
188
-
189
-
190
-
191
-
192
 |
 |

57
57
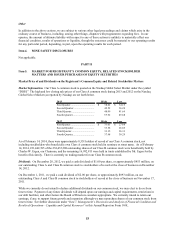
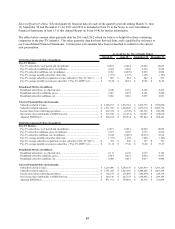
Selected Quarterly Data. Selected quarterly financial data for each of the quarterly periods ending March 31, June
30, September 30 and December 31 for 2013 and 2012 is included in Note 19 in the Notes to our Consolidated
Financial Statements in Item 15 of this Annual Report on Form 10-K for further information.
The tables below contain other quarterly data for 2013 and 2012 which we believe is helpful for those evaluating
companies in the pay-TV industry. This other quarterly data has been derived from, and is qualified by reference to
our Consolidated Financial Statements. Certain prior year amounts have been reclassified to conform to the current
year presentation.
March 31 June 30 September 30 December 31
2013 Other Quarterl
y
Data (Unaudited)
Pa
y
-TV Metrics
Pay-TV subscribers, as of period end (in millions)................................................. 14.092 14.014 14.049 14.057
Pay-TV subscriber additions, gross (in millions).................................................... 0.654 0.624 0.734 0.654
Pay-TV subscriber additions, net (in millions)........................................................ 0.036 (0.078) 0.035 0.008
Pay-TV average monthly subscriber churn rate...................................................... 1.47% 1.67% 1.66% 1.53%
Pay-TV average subscriber acquisition cost per subscriber (“Pay-TV SAC”)........ 882$ 883$ 842$ 863$
Pay-TV average monthly revenue per subscriber (“Pay-TV ARPU”)(1)............... 78.44$ 80.81$ 80.98$ 81.24$
Broadband Metrics (in millions)
Broadband subscribers, as of period end................................................................ 0.249 0.310 0.385 0.436
Broadband subscriber additions, gross.................................................................... 0.083 0.079 0.101 0.080
Broadband subscriber additions, net....................................................................... 0.066 0.061 0.075 0.051
Selected Financial Data (in thousands)
Subscriber-related revenue...................................................................................... 3,348,167$ 3,452,764$ 3,463,753$ 3,500,090$
Subscriber-related expenses.................................................................................... 1,911,593$ 1,924,020$ 1,976,712$ 2,005,736$
Income (loss) from continuing operations............................................................... 212,234$ (8,720)$ 343,325$ 290,250$
Net income (loss) attributable to DISH Network.................................................... 215,598$ (11,051)$ 314,907$ 288,038$
Adjusted EBITDA(2).............................................................................................. 698,108$ 430,574$ 787,844$ 888,281$
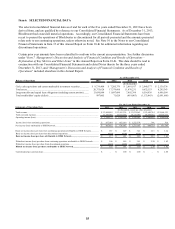
2012 Other Quarterl
y
Data (Unaudited)
Pa
y
-TV Metrics
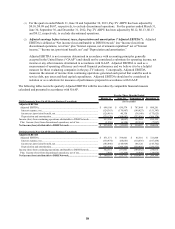
Pay-TV subscribers, as of period end (in millions)................................................. 14.071 14.061 14.042 14.056
Pay-TV subscriber additions, gross (in millions).................................................... 0.673 0.665 0.739 0.662
Pay-TV subscriber additions, net (in millions)........................................................ 0.104 (0.010) (0.019) 0.014
Pay-TV average monthly subscriber churn rate...................................................... 1.35% 1.60% 1.80% 1.54%
Pay-TV average subscriber acquisition cost per subscriber (“Pay-TV SAC”)........ 747$ 800$ 797$ 791$
Pay-TV average monthly revenue per subscriber (“Pay-TV ARPU”)(1)............... 76.12$ 77.46$ 76.86$ 77.47$
Broadband Metrics (in millions)
Broadband subscribers, as of period end................................................................ 0.111 0.122 0.139 0.183
Broadband subscriber additions, gross.................................................................... 0.014 0.021 0.029 0.057
Broadband subscriber additions, net....................................................................... 0.006 0.011 0.017 0.044
Selected Financial Data (in thousands)
Subscriber-related revenue...................................................................................... 3,219,490$ 3,290,378$ 3,261,939$ 3,293,129$
Subscriber-related expenses.................................................................................... 1,761,252$ 1,823,665$ 1,808,285$ 1,861,256$
Income (loss) from continuing operations............................................................... 352,166$ 236,865$ (154,430)$ 228,318$
Net income (loss) attributable to DISH Network.................................................... 360,310$ 225,732$ (158,461)$ 209,106$
Adjusted EBITDA(2).............................................................................................. 871,371$ 769,001$ 45,310$ 721,804$
As of and for the Three Months Ended