Dish Network 2013 Annual Report Download - page 130
Download and view the complete annual report
Please find page 130 of the 2013 Dish Network annual report below. You can navigate through the pages in the report by either clicking on the pages listed below, or by using the keyword search tool below to find specific information within the annual report.-
 1
1 -
2
-
3
-
4
-
5
-
6
-
7
-
8
-
9
-
10
-
11
-
12
-
13
-
14
-
15
-
16
-
17
-
18
-
19
-
20
-
21
-
22
-
23
-
24
-
25
-
26
-
27
-
28
-
29
-
30
-
31
-
32
-
33
-
34
-
35
-
36
-
37
-
38
-
39
-
40
-
41
-
42
-
43
-
44
-
45
-
46
-
47
-
48
-
49
-
50
-
51
-
52
-
53
-
54
-
55
-
56
-
57
-
58
-
59
-
60
-
61
-
62
-
63
-
64
-
65
-
66
-
67
-
68
-
69
-
70
-
71
-
72
-
73
-
74
-
75
-
76
-
77
-
78
-
79
-
80
-
81
-
82
-
83
-
84
-
85
-
86
-
87
-
88
-
89
-
90
-
91
-
92
-
93
-
94
-
95
-
96
-
97
-
98
-
99
-
100
-
101
-
102
-
103
-
104
-
105
-
106
-
107
-
108
-
109
-
110
-
111
-
112
-
113
-
114
-
115
-
116
-
117
-
118
-
119
-
 120
120 -
 121
121 -
 122
122 -
 123
123 -
 124
124 -
 125
125 -
 126
126 -
 127
127 -
 128
128 -
 129
129 -
 130
130 -
 131
131 -
 132
132 -
 133
133 -
 134
134 -
 135
135 -
 136
136 -
 137
137 -
 138
138 -
 139
139 -
 140
140 -
141
-
142
-
143
-
144
-
145
-
146
-
147
-
148
-
149
-
150
-
151
-
152
-
153
-
154
-
155
-
156
-
157
-
158
-
159
-
160
-
161
-
162
-
163
-
164
-
165
-
166
-
167
-
168
-
169
-
170
-
171
-
172
-
173
-
174
-
175
-
176
-
177
-
178
-
179
-
180
-
181
-
182
-
183
-
184
-
185
-
186
-
187
-
188
-
189
-
190
-
191
-
192
 |
 |

DISH NETWORK CORPORATION
NOTES TO CONSOLIDATED FINANCIAL STATEMENTS - Continued
F-20
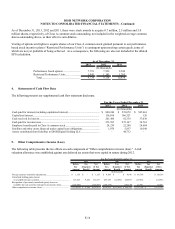
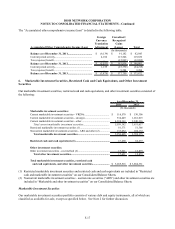
debt securities would not be able to pay interest as it becomes due or repay the principal at maturity. Therefore, we
believe that these changes in the estimated fair values of these marketable investment securities are related to
temporary market fluctuations.
Fair Unrealized Fair Unrealized
Value Loss Value Loss
(In thousands)
Debt Securities:
Less than 12 months....... 2,208,930$ (3,106)$ 761,551$ (909)$
12 months or more......... 84,915 (6,773) 72,395 (8,327)
Equity Securities:
Less than 12 months....... - - 154,566 (11,537)
12 months or more......... - - - -
Total................................. 2,293,845$ (9,879)$ 988,512$ (20,773)$
As of December 31,
2013 2012
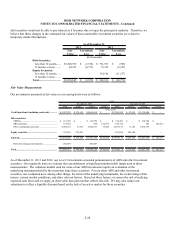
Fair Value Measurements
Our investments measured at fair value on a recurring basis were as follows:
Total Level 1 Level 2 Level 3 Total Level 1 Level 2 Level 3
(In thousands)
Cash Equivalents (including restricted).............. 4,387,252$ 323,638$ 4,063,614$-$ 3,386,929$ 67,833$ 3,319,096$-$
Debt securities:
VRDNs................................................................ 116,570$ -$ 116,570$ -$ 130,306$ -$ 130,306$ -$
ARS and other..................................................... 133,652 - 678 132,974 106,172 - 955 105,217
Other (including restricted)................................ 4,668,532 11,015 4,644,471 13,046 3,287,317 11,182 3,276,135 -
Equity securities.................................................... 335,651 335,651 - - 265,380 265,380 - -
Subtotal.................................................................. 5,254,405$ 346,666$ 4,761,719$ 146,020$ 3,789,175$ 276,562$ 3,407,396$ 105,217$
Derivative financial instruments.......................... 292,507 - 292,507 - - - - -
Total....................................................................... 5,546,912$ 346,666$ 5,054,226$ 146,020$ 3,789,175$ 276,562$ 3,407,396$ 105,217$
- -
As of
December 31, 2013 December 31, 2012
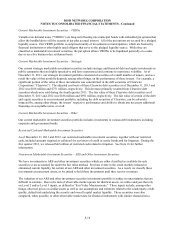
As of December 31, 2013 and 2012, our Level 3 investments consisted predominately of ARS and other investment
securities. On a quarterly basis we evaluate the reasonableness of significant unobservable inputs used in those
measurements. The valuation models used for some of our ARS investments require an evaluation of the
underlying instruments held by the trusts that issue these securities. For our other ARS and other investment
securities, our evaluation uses, among other things, the terms of the underlying instruments, the credit ratings of the
issuers, current market conditions, and other relevant factors. Based on these factors, we assess the risk of realizing
expected cash flows and we apply an observable discount rate that reflects this risk. We may also reduce our
valuations to reflect a liquidity discount based on the lack of an active market for these securities.