Dish Network 2013 Annual Report Download - page 175
Download and view the complete annual report
Please find page 175 of the 2013 Dish Network annual report below. You can navigate through the pages in the report by either clicking on the pages listed below, or by using the keyword search tool below to find specific information within the annual report.-
 1
1 -
2
-
3
-
4
-
5
-
6
-
7
-
8
-
9
-
10
-
11
-
12
-
13
-
14
-
15
-
16
-
17
-
18
-
19
-
20
-
21
-
22
-
23
-
24
-
25
-
26
-
27
-
28
-
29
-
30
-
31
-
32
-
33
-
34
-
35
-
36
-
37
-
38
-
39
-
40
-
41
-
42
-
43
-
44
-
45
-
46
-
47
-
48
-
49
-
50
-
51
-
52
-
53
-
54
-
55
-
56
-
57
-
58
-
59
-
60
-
61
-
62
-
63
-
64
-
65
-
66
-
67
-
68
-
69
-
70
-
71
-
72
-
73
-
74
-
75
-
76
-
77
-
78
-
79
-
80
-
81
-
82
-
83
-
84
-
85
-
86
-
87
-
88
-
89
-
90
-
91
-
92
-
93
-
94
-
95
-
96
-
97
-
98
-
99
-
100
-
101
-
102
-
103
-
104
-
105
-
106
-
107
-
108
-
109
-
110
-
111
-
112
-
113
-
114
-
115
-
116
-
117
-
118
-
119
-
120
-
121
-
122
-
123
-
124
-
125
-
126
-
127
-
128
-
129
-
130
-
131
-
132
-
133
-
134
-
135
-
136
-
137
-
138
-
139
-
140
-
141
-
142
-
143
-
144
-
145
-
146
-
147
-
148
-
149
-
150
-
151
-
152
-
153
-
154
-
155
-
156
-
157
-
158
-
159
-
160
-
161
-
162
-
163
-
164
-
 165
165 -
 166
166 -
 167
167 -
 168
168 -
 169
169 -
 170
170 -
 171
171 -
 172
172 -
 173
173 -
 174
174 -
 175
175 -
 176
176 -
 177
177 -
 178
178 -
 179
179 -
 180
180 -
 181
181 -
 182
182 -
 183
183 -
 184
184 -
 185
185 -
186
-
187
-
188
-
189
-
190
-
191
-
192
 |
 |

DISH NETWORK CORPORATION
NOTES TO CONSOLIDATED FINANCIAL STATEMENTS - Continued
F-65
2013 2012
Total assets :
DISH.......................................................................................................... 19,713,853$ 16,224,949$
Wireless...................................................................................................... 4,625,505 5,066,615
Eliminations............................................................................................... (4,041,934) (4,189,097)
Total assets from continuing operations..................................................... 20,297,424 17,102,467
Assets from discontinued operations.......................................................... 78,204 277,141
Total assets................................................................................................. 20,375,628$ 17,379,608$
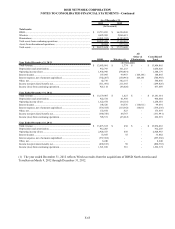
All
Other & Consolidated
DISH Wireless (1) Eliminations Total
Year Ended December 31, 2013
Total revenue.............................................................................................. 13,903,091$ 1,774$ -$ 13,904,865$
Depreciation and amortization................................................................... 952,793 101,233 - 1,054,026
Operating income (loss) ............................................................................ 1,938,998 (590,819) - 1,348,179
Interest income........................................................................................... 197,095 99,953 (148,183) 148,865
Interest expense, net of amounts capitalized.............................................. (742,207) (150,961) 148,183 (744,985)
Other, net.................................................................................................... 42,719 342,137 - 384,856
Income tax (provision) benefit, net............................................................. (511,491) 211,665 - (299,826)
Income (loss) from continuing operations.................................................. 925,114 (88,026) - 837,089
Year Ended December 31, 2012
Total revenue.............................................................................................. 13,179,907$ 1,427$ -$ 13,181,334$
Depreciation and amortization................................................................... 922,534 41,950 - 964,484
Operating income (loss) ............................................................................ 1,322,474 (64,116) - 1,258,358
Interest income........................................................................................... 148,526 64,576 (114,011) 99,091
Interest expense, net of amounts capitalized.............................................. (534,585) (115,662) 114,011 (536,236)
Other, net.................................................................................................... 172,874 823 - 173,697
Income tax (provision) benefit, net............................................................. (380,758) 48,767 - (331,991)
Income (loss) from continuing operations.................................................. 728,531 (65,612) - 662,919
Year Ended December 31, 2011
Total revenue.............................................................................................. 13,073,633$ 430$ -$ 13,074,063$
Depreciation and amortization................................................................... 912,203 - - 912,203
Operating income (loss)............................................................................. 2,928,553 430 - 2,928,983
Interest income........................................................................................... 33,847 35 - 33,882
Interest expense, net of amounts capitalized.............................................. (557,966) - - (557,966)
Other, net.................................................................................................... 8,240 - - 8,240
Income tax (provision) benefit, net............................................................. (890,815) 50 - (890,765)
Income (loss) from continuing operations.................................................. 1,521,858 516 - 1,522,374
As of December 31,
(In thousands)
(In thousands)
(1) The year ended December 31, 2012 reflects Wireless results from the acquisitions of DBSD North America and
TerreStar on March 9, 2012 through December 31, 2012.