Dish Network 2013 Annual Report Download - page 69
Download and view the complete annual report
Please find page 69 of the 2013 Dish Network annual report below. You can navigate through the pages in the report by either clicking on the pages listed below, or by using the keyword search tool below to find specific information within the annual report.-
 1
1 -
2
-
3
-
4
-
5
-
6
-
7
-
8
-
9
-
10
-
11
-
12
-
13
-
14
-
15
-
16
-
17
-
18
-
19
-
20
-
21
-
22
-
23
-
24
-
25
-
26
-
27
-
28
-
29
-
30
-
31
-
32
-
33
-
34
-
35
-
36
-
37
-
38
-
39
-
40
-
41
-
42
-
43
-
44
-
45
-
46
-
47
-
48
-
49
-
50
-
51
-
52
-
53
-
54
-
55
-
56
-
57
-
58
-
 59
59 -
 60
60 -
 61
61 -
 62
62 -
 63
63 -
 64
64 -
 65
65 -
 66
66 -
 67
67 -
 68
68 -
 69
69 -
 70
70 -
 71
71 -
 72
72 -
 73
73 -
 74
74 -
 75
75 -
 76
76 -
 77
77 -
 78
78 -
 79
79 -
80
-
81
-
82
-
83
-
84
-
85
-
86
-
87
-
88
-
89
-
90
-
91
-
92
-
93
-
94
-
95
-
96
-
97
-
98
-
99
-
100
-
101
-
102
-
103
-
104
-
105
-
106
-
107
-
108
-
109
-
110
-
111
-
112
-
113
-
114
-
115
-
116
-
117
-
118
-
119
-
120
-
121
-
122
-
123
-
124
-
125
-
126
-
127
-
128
-
129
-
130
-
131
-
132
-
133
-
134
-
135
-
136
-
137
-
138
-
139
-
140
-
141
-
142
-
143
-
144
-
145
-
146
-
147
-
148
-
149
-
150
-
151
-
152
-
153
-
154
-
155
-
156
-
157
-
158
-
159
-
160
-
161
-
162
-
163
-
164
-
165
-
166
-
167
-
168
-
169
-
170
-
171
-
172
-
173
-
174
-
175
-
176
-
177
-
178
-
179
-
180
-
181
-
182
-
183
-
184
-
185
-
186
-
187
-
188
-
189
-
190
-
191
-
192
 |
 |
Item 7. MANAGEMENT’S DISCUSSION AND ANALYSIS OF FINANCIAL CONDITION AND
RESULTS OF OPERATIONS
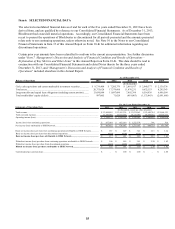
59
59
You should read the following management’s discussion and analysis of our financial condition and results of
operations together with the audited consolidated financial statements and notes to our financial statements
included elsewhere in this Annual Report. This management’s discussion and analysis is intended to help provide
an understanding of our financial condition, changes in financial condition and results of our operations and
contains forward-looking statements that involve risks and uncertainties. The forward-looking statements are not
historical facts, but rather are based on current expectations, estimates, assumptions and projections about our
industry, business and future financial results. Our actual results could differ materially from the results
contemplated by these forward-looking statements due to a number of factors, including those discussed in this
report, including under the caption “Item 1A. Risk Factors” in this Annual Report on Form 10-K.
EXECUTIVE SUMMARY
Overview
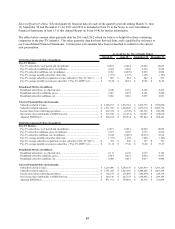
DISH added approximately 1,000 net Pay-TV subscribers during the year ended December 31, 2013, compared to
the addition of approximately 89,000 net Pay-TV subscribers during the same period in 2012. The decrease versus
the same period in 2012 primarily resulted from lower gross new Pay-TV subscriber activations. During the year
ended December 31, 2013, DISH activated approximately 2.666 million gross new Pay-TV subscribers compared to
approximately 2.739 million gross new Pay-TV subscribers during the same period in 2012, a decrease of 2.7%.
Our gross new Pay-TV subscriber activations continue to be negatively impacted by increased competitive
pressures, including aggressive marketing, discounted promotional offers, and more aggressive retention efforts in a
mature market. In addition, our gross new Pay-TV subscriber activations continue to be adversely affected by
sustained economic weakness and uncertainty.
Our Pay-TV churn rate for the year ended December 31, 2013 was 1.58% compared to 1.57% for the same period in
2012. Our Pay-TV churn rate was negatively impacted in part because we increased our programming package
price in the first quarter 2013 and did not during the same period in 2012. Churn continues to be adversely affected
by increased competitive pressures, including aggressive marketing and discounted promotional offers. Our Pay-TV
churn rate is also impacted by, among other things, the credit quality of previously acquired subscribers, our ability
to consistently provide outstanding customer service, price increases, service interruptions driven by programming
disputes, and our ability to control piracy and other forms of fraud.
On September 27, 2012, we began marketing our satellite broadband service under the dishNET™ brand. This
service leverages advanced technology and high-powered satellites launched by Hughes and ViaSat to provide
broadband coverage nationwide. This service primarily targets approximately 15 million rural residents that are
underserved, or unserved, by wireline broadband, and provides download speeds of up to 10 Mbps. We lease the
customer premise equipment to subscribers and generally pay Hughes and ViaSat a wholesale rate per subscriber on
a monthly basis. Currently, we generally utilize our existing DISH distribution channels under similar incentive
arrangements as our pay-TV business to acquire new Broadband subscribers.
In addition to the dishNET branded satellite broadband service, we also offer wireline voice and broadband services
under the dishNET brand as a competitive local exchange carrier to consumers living in a 14-state region (Arizona,
Colorado, Idaho, Iowa, Minnesota, Montana, Nebraska, New Mexico, North Dakota, Oregon, South Dakota, Utah,
Washington and Wyoming). Our dishNET branded wireline broadband service provides download speeds of up to
20 Mbps.
We primarily bundle our dishNET branded services with our DISH branded pay-TV service, to offer customers a
single bill, payment and customer service option, which includes a discount for bundled services. In addition, we
market and sell our dishNET branded services on a stand-alone basis.