Dish Network 2013 Annual Report Download - page 66
Download and view the complete annual report
Please find page 66 of the 2013 Dish Network annual report below. You can navigate through the pages in the report by either clicking on the pages listed below, or by using the keyword search tool below to find specific information within the annual report.-
 1
1 -
2
-
3
-
4
-
5
-
6
-
7
-
8
-
9
-
10
-
11
-
12
-
13
-
14
-
15
-
16
-
17
-
18
-
19
-
20
-
21
-
22
-
23
-
24
-
25
-
26
-
27
-
28
-
29
-
30
-
31
-
32
-
33
-
34
-
35
-
36
-
37
-
38
-
39
-
40
-
41
-
42
-
43
-
44
-
45
-
46
-
47
-
48
-
49
-
50
-
51
-
52
-
53
-
54
-
55
-
 56
56 -
 57
57 -
 58
58 -
 59
59 -
 60
60 -
 61
61 -
 62
62 -
 63
63 -
 64
64 -
 65
65 -
 66
66 -
 67
67 -
 68
68 -
 69
69 -
 70
70 -
 71
71 -
 72
72 -
 73
73 -
 74
74 -
 75
75 -
 76
76 -
77
-
78
-
79
-
80
-
81
-
82
-
83
-
84
-
85
-
86
-
87
-
88
-
89
-
90
-
91
-
92
-
93
-
94
-
95
-
96
-
97
-
98
-
99
-
100
-
101
-
102
-
103
-
104
-
105
-
106
-
107
-
108
-
109
-
110
-
111
-
112
-
113
-
114
-
115
-
116
-
117
-
118
-
119
-
120
-
121
-
122
-
123
-
124
-
125
-
126
-
127
-
128
-
129
-
130
-
131
-
132
-
133
-
134
-
135
-
136
-
137
-
138
-
139
-
140
-
141
-
142
-
143
-
144
-
145
-
146
-
147
-
148
-
149
-
150
-
151
-
152
-
153
-
154
-
155
-
156
-
157
-
158
-
159
-
160
-
161
-
162
-
163
-
164
-
165
-
166
-
167
-
168
-
169
-
170
-
171
-
172
-
173
-
174
-
175
-
176
-
177
-
178
-
179
-
180
-
181
-
182
-
183
-
184
-
185
-
186
-
187
-
188
-
189
-
190
-
191
-
192
 |
 |

56
56
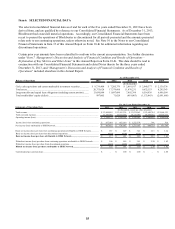
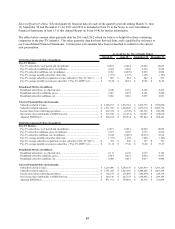
Other Data (Unaudited except for net cash flows) 2013 2012 2011 2010 2009
Pay-TV subscribers, as of period end (in millions)................................................. 14.057 14.056 13.967 14.133 14.100
Pay-TV subscriber additions, gross (in millions).................................................... 2.666 2.739 2.576 3.052 3.118
Pay-TV subscriber additions, net (in millions)....................................................... 0.001 0.089 (0.166) 0.033 0.422
Pay-TV average monthly subscriber churn rate...................................................... 1.58% 1.57% 1.63% 1.76% 1.64%
Pay-TV average subscriber acquisition cost per subscriber (“Pay-TV SAC”)........ 866$ 784$ 770$ NA NA
Pay-TV average monthly revenue per subscriber (“Pay-TV ARPU”)................... 80.37$ 76.98$ * 76.43$ * NA NA
Average subscriber acquisition cost per subscriber (“SAC”).................................. ** ** 771$ 776$ 697$
Average monthly revenue per subscriber (“ARPU”)............................................. ** ** 76.91$ * 73.32$ 70.04$
Broadband subscribers, as of period end (in millions)............................................ 0.436 0.183 0.105 NA NA
Broadband subscriber additions, gross (in millions)............................................... 0.343 0.121 0.030 NA NA
Broadband subscriber additions, net (in millions).................................................. 0.253 0.078 (0.005) NA NA
Net cash flows from (in thousands):
Operating activities from continuing operations................................................ 2,309,197$ 2,003,718$ 2,619,160$ 2,139,802$ 2,194,543$
Investing activities from continuing operations................................................. (3,034,857)$ (3,004,082)$ (2,783,172)$ (1,477,521)$ (2,605,556)$
Financing activities from continuing operations................................................ 1,851,940$ 4,003,933$ 93,513$ (127,453)$ 418,283$
For the Years Ended December 31,
* For the years ended December 31, 2012 and 2011, Pay-TV ARPU has been adjusted by $0.12 and $0.02,
respectively, to exclude the effect of discontinued operations. In addition, for the year ended December 31, 2011,
ARPU has been adjusted by $0.02 to exclude the effect of discontinued operations.
** During the fourth quarter 2012, following the launch of the dishNET branded broadband services, we
determined SAC and ARPU, which combined pay-TV and certain broadband activity, no longer provided a
meaningful comparison between periods; therefore, during the fourth quarter 2012, we began providing Pay-TV
SAC and Pay-TV ARPU metrics which we believe provides a more meaningful comparison between periods. See
“Explanation of Key Metrics and Other Items” for further information.