Costco 1999 Annual Report Download - page 32
Download and view the complete annual report
Please find page 32 of the 1999 Costco annual report below. You can navigate through the pages in the report by either clicking on the pages listed below, or by using the keyword search tool below to find specific information within the annual report.-
 1
1 -
2
-
3
-
4
-
5
-
6
-
7
-
8
-
9
-
10
-
11
-
12
-
13
-
14
-
15
-
16
-
17
-
18
-
19
-
20
-
21
-
 22
22 -
 23
23 -
 24
24 -
 25
25 -
 26
26 -
 27
27 -
 28
28 -
 29
29 -
 30
30 -
 31
31 -
 32
32 -
 33
33 -
 34
34 -
 35
35 -
 36
36 -
 37
37 -
 38
38 -
 39
39 -
 40
40
 |
 |

COSTCO COMPANIES, INC.
NOTES TO CONSOLIDATED FINANCIAL STATEMENTS (Continued)
(dollars in thousands, except per share data)
Note 4—Stock Options (Continued)
The effects of applying SFAS No. 123 on pro forma disclosures of net income and earnings per share
for fiscal 1999, 1998 and 1997 are not likely to be representative of the pro forma effects on net income and
earnings per share in future years.
The fair value of each option grant is estimated on the date of grant using the Black-Scholes option
pricing model with the following weighted average assumptions used for grants in 1999, 1998 and 1997:
1999 1998 1997
Risk free interest rate ......................... 5.09% 5.60% 6.40%
Expected life ................................ 7 years 7 years 7 years
Expected volatility ............................ 37% 34% 34%
Expected dividend yield ........................ 0% 0% 0%
Stock option transactions relating to the aggregate of the Old and New Stock Option Plans are
summarized below (shares in thousands):
1999 1998 1997
Shares Price(1) Shares Price(1) Shares Price(1)
Under option at beginning of year ........... 17,302 $27.03 17,321 $19.96 16,972 $17.14
Granted (2) ........................... 4,553 73.79 4,214 47.67 4,610 26.13
Exercised ............................. (3,262) 19.89 (3,996) 18.59 (4,077) 15.24
Cancelled ............................. (204) 36.68 (237) 19.81 (184) 18.37
Under option at end of year ............... 18,389 $39.77 17,302 $27.03 17,321 $19.96
(1) Weighted-average exercise price.
(2) The weighted-average fair value of options granted during fiscal 1999, 1998 and 1997, were $31.00,
$19.71, and $11.47, respectively.
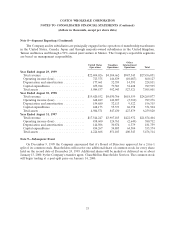
The following table summarizes information regarding stock options outstanding at August 29, 1999:
Options
Options Outstanding Exercisable
Remaining
Contractual
Range of Prices Number Life(1) Price(1) Number Price(1)
$9.88 - $25.50 .............................. 6,226 4.4 $17.22 4,100 $33.52
$26.63 - $45.75 ............................. 6,280 7.6 34.65 1,799 52.87
$46.63 - $89.94 ............................. 5,883 9.3 69.11 345 59.66
18,389 7.1 $39.77 6,244 $42.37
(1) Weighted-average.
30