Costco 1999 Annual Report Download - page 10
Download and view the complete annual report
Please find page 10 of the 1999 Costco annual report below. You can navigate through the pages in the report by either clicking on the pages listed below, or by using the keyword search tool below to find specific information within the annual report.-
 1
1 -
 2
2 -
 3
3 -
 4
4 -
 5
5 -
 6
6 -
 7
7 -
 8
8 -
 9
9 -
 10
10 -
 11
11 -
 12
12 -
 13
13 -
 14
14 -
 15
15 -
 16
16 -
 17
17 -
 18
18 -
 19
19 -
 20
20 -
 21
21 -
22
-
23
-
24
-
25
-
26
-
27
-
28
-
29
-
30
-
31
-
32
-
33
-
34
-
35
-
36
-
37
-
38
-
39
-
40
 |
 |

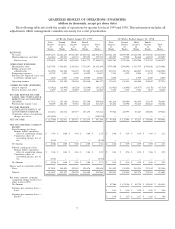
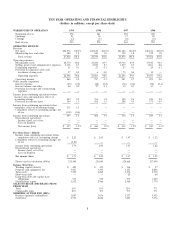
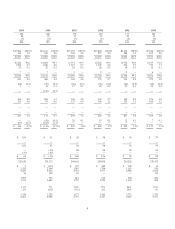
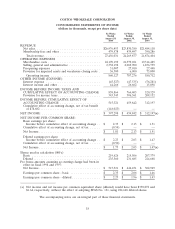
TEN YEAR OPERATING AND FINANCIAL HIGHLIGHTS
(dollars in millions, except per share data)
1999 1998 1997 1996WAREHOUSES IN OPERATION
Beginning of year 278 261 252 240
Openings
8
21 18 17 20
Closings (7) (1) (8) (8)
End of year 292 278 261 252
OPERATING RESULTS
Revenue
Net sales $26,976 100.0% $23,830 100.0% $21,484 100.0% $19,214 100.0%
Membership fees and other 480 1.8 440 1.8 390 1.8 352 1.8
Total revenue 27,456 101.8 24,270 101.8 21,874 101.8 19,566 101.8
Operating expenses
Merchandise costs 24,170 89.6 21,380 89.7 19,314 89.9 17,345 90.3
Selling, general and administrative expenses 2,338 8.7 2,070 8.7 1,877 8.7 1,691 8.8
Preopening expenses 31 0.1 27 0.1 27 0.1 29 0.1
Provision for impaired assets and
warehouse closing costs 57 0.2 6 0.0 75 0.4 10 —
Operating expenses 26,596 98.6 23,483 98.5 21,293 99.1 19,075 99.2
Operating income 860 3.2 787 3.3 581 2.7 491 2.6
Other income (expenses)
Interest expense (45) (0.2) (48) (0.2) (76) (0.4) (78) (0.4)
Interest income and other 44 0.2 27 0.1 15 0.1 11 —
Provision for merger and restructuring
expenses — — — — — — — —
Income from continuing operations before
income taxes and cumulative effect of
accounting change 859 3.2 766 3.2 520 2.4 424 2.2
Provision for income taxes 344 1.3 306 1.3 208 0.9 175 0.9
Income from continuing operations before
cumulative effect of accounting change 515 1.9 — — — — — —
Cumulative effect of accounting change, net
of tax (118) (0.4) — — — — — —
Income from continuing operations 397 1.5 460 1.9 312 1.5 249 1.3
Discontinued operations:
Income (loss), net of tax — — — — — — — —
Loss on disposal — — — — — — — —
Net income (loss) $ 397 1.5% $ 460 1.9% $ 312 1.5% $ 249 1.3%
Per Share Data—Diluted
Income from continuing operations before
cumulative effect of accounting change $ 2.23 $ 2.03 $ 1.47 $ 1.22
Cumulative effect of accounting change, net
of tax (0.50) — — —
Income from continuing operations 1.73 2.03 1.47 1.22
Discontinued operations:
Income (loss), net of tax ————
Loss on disposal ————
Net income (loss) $ 1.73 $ 2.03 $ 1.47 $ 1.22
Shares used in calculation (000’s) 235,560 231,685 224,668 217,890
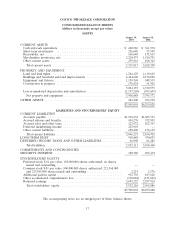
Balance Sheet Data
Working capital (deficit) $ 450 $ 431 $ 146 $ 57
Property and equipment, net 3,907 3,395 3,155 2,888
Total assets 7,505 6,260 5,476 4,912
Short-term debt — — 25 60
Long-term debt and capital lease
obligations 919 930 917 1,229
Stockholders’ equity 3,532 2,966 2,468 1,778
SALES INCREASE (DECREASE) FROM
PRIOR YEAR
Total 13% 11% 12% 7%
Comparable units 10% 8% 9% 5%
MEMBERS AT YEAR END (000’s)
Business (primary cardholders) 3,887 3,676 3,537 3,435
Gold Star 9,555 8,654 7,845 7,076