Costco 1999 Annual Report Download - page 3
Download and view the complete annual report
Please find page 3 of the 1999 Costco annual report below. You can navigate through the pages in the report by either clicking on the pages listed below, or by using the keyword search tool below to find specific information within the annual report.-
 1
1 -
 2
2 -
 3
3 -
 4
4 -
 5
5 -
 6
6 -
 7
7 -
 8
8 -
 9
9 -
 10
10 -
 11
11 -
 12
12 -
 13
13 -
 14
14 -
15
-
16
-
17
-
18
-
19
-
20
-
21
-
22
-
23
-
24
-
25
-
26
-
27
-
28
-
29
-
30
-
31
-
32
-
33
-
34
-
35
-
36
-
37
-
38
-
39
-
40
 |
 |

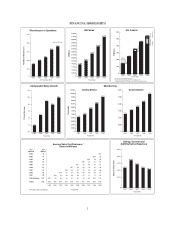
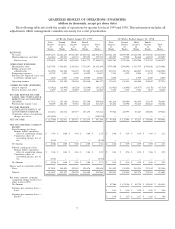
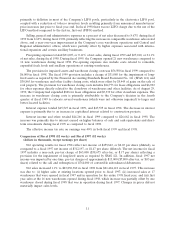
FINANCIAL HIGHLIGHTS
Comparable Sales Growth
Fiscal Year
Percent Increase
12%
10%
1995 1996 1997 1998 1999
8%
6%
2%
5%
8%
10%
9%
4%
2%
0%
Fiscal Year
1995 1996 1997 1998 1999
3,318
3,435
3,676
3,887
3,537
3,000
3,200
3,400
3,600
3,800
4,000
0
Business Members
Fiscal Year
Thousands
1995 1996 1997 1998 1999
6,683
7,076
8,654
9,555
7,845
5,500
6,500
5,000
6,000
7,500
8,500
9,500
7,000
8,000
9,000
10,000
10,500
0
Gold Star Members
Membership
Selling, General and
Administrative Expenses
Fiscal Year
Percent of Net Sales
1995 1996 1997 1998 1999
8.69%
8.80%
8.69% 8.67%
8.74%
8.65%
8.55%
8.75%
8.95%
0
8.85%
Net Sales
Fiscal Year
$ Millions
28,000
27,000
26,000
25,000
24,000
23,000
22,000
21,000
20,000
19,000
18,000
17,000
16,000
15,000
01995 1996 1997 1998 1999
17,906
19,214
23,830
26,976
21,484
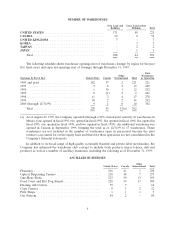
Warehouses in Operation
At Fiscal Year End
Number of Warehouses
325
300
1995 1996 1997 1998 1999
275
250
240
252
278
292
(302 at 12/31/99)
261
225
0
Average Sales Per Warehouse *
(Sales In Millions)
Fiscal Year
199919981997199619951994199319921991
*First year sales annualized
1990
87807569656154$48
908479746962$59
9083766860$57
686153$46
76
69
58
$51 82
8570
58
$65
$50
$56
8477716764636058
$49
116106999289919398
93
$83
$94$87$83$77$75$76$78$84
$86
$83
292Totals
1071990 & Before
201991
261992
341993
271994
191995
181996
101997
171998
141999
Whses*Opened # ofYear
Net Income
*
**
Income from continuing operations
Income from continuing operations excluding asset
impairment/warehouse closing costs and/or accounting change
Fiscal Year
$ Millions
1995 1996 1997 1998 1999
217*
249*
460*
545**
Discont'd
Ops
Closing/
Impairment
Asset
Impairment
Accounting
Change
351**
100
200
300
400
500
600
0
134
312*
515**
397*
1