Costco 1999 Annual Report Download - page 22
Download and view the complete annual report
Please find page 22 of the 1999 Costco annual report below. You can navigate through the pages in the report by either clicking on the pages listed below, or by using the keyword search tool below to find specific information within the annual report.-
 1
1 -
2
-
3
-
4
-
5
-
6
-
7
-
8
-
9
-
10
-
11
-
 12
12 -
 13
13 -
 14
14 -
 15
15 -
 16
16 -
 17
17 -
 18
18 -
 19
19 -
 20
20 -
 21
21 -
 22
22 -
 23
23 -
 24
24 -
 25
25 -
 26
26 -
 27
27 -
 28
28 -
 29
29 -
 30
30 -
 31
31 -
 32
32 -
33
-
34
-
35
-
36
-
37
-
38
-
39
-
40
 |
 |

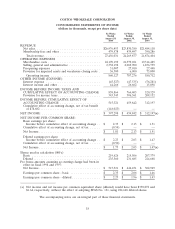
COSTCO WHOLESALE CORPORATION
CONSOLIDATED STATEMENTS OF CASH FLOWS
(dollars in thousands)
52 Weeks 52 Weeks 52 Weeks
Ended Ended Ended
August 29, August 30, August 31,
1999 1998 1997
CASH FLOWS FROM OPERATING ACTIVITIES
Net income ...................................... $397,298 $ 459,842 $ 312,197
Adjustments to reconcile net income to net cash provided by
operating activities:
Depreciation and amortization ....................... 224,811 196,315 181,759
Accretion of discount on zero coupon notes ............. 16,064 15,875 567
Net gain on sale of property and equipment and other ..... (10,443) (3,459) (602)
Provision for impaired assets ........................ 31,080 5,629 65,000
Change in deferred income taxes ..................... (22,666) 20,420 (4,322)
Cumulative effect of accounting change, net of tax ........ 118,023 — —
Change in receivables, other current assets, accrued and
other current liabilities ........................... 195,528 60,315 66,303
Increase in merchandise inventories ................... (286,902) (255,140) (189,323)
Increase in accounts payable ........................ 284,238 243,164 162,628
Other ......................................... (6,168) (5,351) (3,958)
Total adjustments ............................... 543,565 277,768 278,052
Net cash provided by operating activities ............... 940,863 737,610 590,249
CASH FLOWS FROM INVESTING ACTIVITIES
Additions to property and equipment .................... (787,935) (571,904) (553,374)
Proceeds from the sale of property and equipment .......... 58,670 80,698 40,946
Investment in unconsolidated joint ventures ............... (15,000) (11,595) (4,750)
Increase in short-term investments ...................... (181,103) (75,549) —
Increase in other assets and other, net ................... (28,555) (31,096) (25,995)
Net cash used in investing activities ..................... (953,923) (609,446) (543,173)
CASH FLOWS FROM FINANCING ACTIVITIES
Repayments under short-term credit facilities, net ........... — (24,404) (33,990)
Net proceeds from issuance of long-term debt ............. 10,336 9,928 461,035
Repayments of long-term debt ......................... (11,675) (9,307) (471,791)
Changes in bank overdraft ........................... 10,203 (3,321) (7,244)
Proceeds from minority interests ....................... 15,058 19,580 15,119
Exercise of stock options ............................. 61,923 74,115 62,015
Net cash provided by financing activities ................ 85,845 66,591 25,144
EFFECT OF EXCHANGE RATE CHANGES ON CASH ..... 5,827 (8,289) 1,333
Net increase in cash and cash equivalents ................ 78,612 186,466 73,553
CASH AND CASH EQUIVALENTS BEGINNING OF YEAR . . 361,974 175,508 101,955
CASH AND CASH EQUIVALENTS END OF YEAR ........ $440,586 $ 361,974 $ 175,508
SUPPLEMENTAL DISCLOSURE OF CASH FLOW
INFORMATION:
Cash paid during the year for:
Interest (excludes amounts capitalized and paid for redemption
premiums) ..................................... $ 27,107 $ 29,191 $ 76,233
Income taxes ..................................... $294,860 $ 257,352 $ 195,241
The accompanying notes are an integral part of these financial statements
20