Cincinnati Bell 2015 Annual Report Download - page 50
Download and view the complete annual report
Please find page 50 of the 2015 Cincinnati Bell annual report below. You can navigate through the pages in the report by either clicking on the pages listed below, or by using the keyword search tool below to find specific information within the annual report.-
 1
1 -
2
-
3
-
4
-
5
-
6
-
7
-
8
-
9
-
10
-
11
-
12
-
13
-
14
-
15
-
16
-
17
-
18
-
19
-
20
-
21
-
22
-
23
-
24
-
25
-
26
-
27
-
28
-
29
-
30
-
31
-
32
-
33
-
34
-
35
-
36
-
37
-
38
-
39
-
 40
40 -
 41
41 -
 42
42 -
 43
43 -
 44
44 -
 45
45 -
 46
46 -
 47
47 -
 48
48 -
 49
49 -
 50
50 -
 51
51 -
 52
52 -
 53
53 -
 54
54 -
 55
55 -
 56
56 -
 57
57 -
 58
58 -
 59
59 -
 60
60 -
61
-
62
-
63
-
64
-
65
-
66
-
67
-
68
-
69
-
70
-
71
-
72
-
73
-
74
-
75
-
76
-
77
-
78
-
79
-
80
-
81
-
82
-
83
-
84
-
85
-
86
-
87
-
88
-
89
-
90
-
91
-
92
-
93
-
94
-
95
-
96
-
97
-
98
-
99
-
100
-
101
-
102
-
103
-
104
-
105
-
106
-
107
-
108
-
109
-
110
-
111
-
112
-
113
-
114
-
115
-
116
-
117
-
118
-
119
-
120
-
121
-
122
-
123
-
124
-
125
-
126
-
127
-
128
-
129
-
130
-
131
-
132
-
133
-
134
-
135
-
136
-
137
-
138
-
139
-
140
-
141
-
142
-
143
-
144
-
145
-
146
-
147
-
148
-
149
-
150
-
151
-
152
-
153
-
154
-
155
-
156
-
157
-
158
-
159
-
160
-
161
-
162
-
163
-
164
-
165
-
166
-
167
-
168
-
169
-
170
-
171
-
172
-
173
-
174
-
175
-
176
-
177
-
178
-
179
-
180
-
181
-
182
-
183
-
184
-
185
-
186
-
187
-
188
-
189
-
190
-
191
-
192
-
193
-
194
-
195
-
196
-
197
-
198
-
199
-
200
-
201
-
202
-
203
-
204
-
205
-
206
-
207
-
208
-
209
-
210
-
211
-
212
-
213
-
214
-
215
-
216
-
217
-
218
-
219
-
220
-
221
-
222
-
223
-
224
-
225
-
226
-
227
-
228
-
229
-
230
-
231
-
232
-
233
-
234
-
235
-
236
-
237
-
238
-
239
-
240
-
241
-
242
-
243
-
244
-
245
-
246
-
247
-
248
-
249
-
250
-
251
-
252
 |
 |

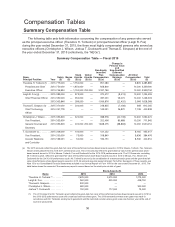
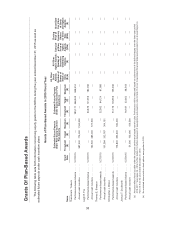
Compensation Tables
Summary Compensation Table
The following table sets forth information concerning the compensation of any person who served
as the principal executive officer (Theodore H. Torbeck) or principal financial officer (Leigh R. Fox)
during the year ended December 31, 2015, the three most highly compensated persons who served as
executive officers (Christopher J. Wilson, Joshua T. Duckworth and Thomas E. Simpson) at the end of
the year ended December 31, 2015 (collectively, the “NEOs”).
Summary Compensation Table — Fiscal 2015
Name,
Principal Position Year
Salary
($)
Bonus
($)
Stock
Awards
($) (a)
Option
Awards
($) (b)
Non-Equity
Incentive
Plan
Compensation
($) (c)
Change in
Pension Value
and
Non-Qualified
Deferred
Compensation
Earnings
($) (d)
All Other
Compensation
($) (e)
Total
($)
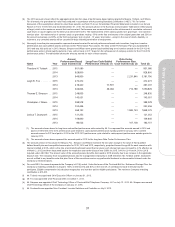
Theodore H. Torbeck (f) . .
2015 775,000 — 1,750,000 — 951,080 — 9,805 3,485,885
President and Chief 2014 750,000 — 1,650,000 — 928,800 — 10,200 3,339,000
Executive Officer 2013 746,954 — 1,150,000 250,000 3,181,790 — 10,000 5,338,744
Leigh R. Fox (g) ........ 2015 385,000 — 375,000 — 472,472 (8,413) 10,400 1,234,459
Chief Financial Officer 2014 350,000 — 350,000 — 497,031 29,072 10,200 1,236,303
2013 303,846 — 286,500 — 1,056,876 (22,420) 3,566 1,628,368
Thomas E. Simpson (h) . .
2015 370,000 — 200,000 — 248,835 (7,038) 468 812,265
Chief Technology 2014 241,778 — — — 145,051 26,870 7,139 420,838
Officer
Christopher J. Wilson .... 2015 353,600 — 320,000 — 398,578 (22,106) 10,400 1,060,472
Vice President, 2014 353,600 — — — 252,456 95,689 10,200 711,945
General Counsel and 2013 353,600 — 200,000 200,000 1,848,275 (68,863) 10,000 2,543,012
Secretary
T. Duckworth (i) .........
2015 206,000 — 100,000 — 121,252 — 8,165 435,417
Vice President, 2014 200,000 — 75,000 — 109,840 — 9,636 394,476
Investor Relations 2013 169,231 — 50,000 — 193,151 — 8,530 420,912
and Controller
(a) The 2015 amounts reflect the grant-date fair value of the performance share-based awards issued in 2015 to Messrs. Torbeck, Fox, Simpson,
Wilson and Duckworth for the 2015-2017 performance cycle. The 2014 amounts reflect the grant-date fair value of the performance share-
based awards issued in 2014 to Messrs. Torbeck, Fox and Duckworth for the 2014-2016 performance cycle. The 2013 amounts, excluding
Mr. Torbeck’s grant, reflect the grant-date fair value of the performance share-based awards issued in 2013 to Messrs. Fox, Wilson and
Duckworth for the 2013-2015 performance cycle. Mr. Torbeck’s amount is the combination of a restricted stock grant and the grant-date fair
value of performance share-based awards issued in 2013. All amounts assume payout at target. For further discussion of these awards, see
Note 15 to our Consolidated Financial Statements included in our Annual Report on Form 10-K for the year ended December 31, 2015. The
table below shows the amounts if the maximum payout is earned based on the stock price at date of grant.
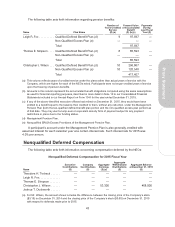
Stock Awards ($)
Name 2015 2014 2013
Theodore H. Torbeck (1) ........ 2,625,000 2,475,000 1,275,000
Leigh R. Fox ................. 562,500 525,000 429,750
Thomas E. Simpson ........... 300,000 — —
Christopher J. Wilson .......... 480,000 — 300,000
Joshua T. Duckworth .......... 150,000 112,500 75,000
(1) The 2013 amount for Mr. Torbeck’s grant reflects the grant-date fair value of the performance share-based awards issued in 2013 for
the 2013-2015 performance cycle and a restricted common share grant. The 2013 restricted common share grant was made in
accordance with Mr. Torbeck’s employment agreement and the restricted common share grant vests one-third per year at the end of
each one-year period.
36