Cincinnati Bell 2015 Annual Report Download - page 224
Download and view the complete annual report
Please find page 224 of the 2015 Cincinnati Bell annual report below. You can navigate through the pages in the report by either clicking on the pages listed below, or by using the keyword search tool below to find specific information within the annual report.-
 1
1 -
2
-
3
-
4
-
5
-
6
-
7
-
8
-
9
-
10
-
11
-
12
-
13
-
14
-
15
-
16
-
17
-
18
-
19
-
20
-
21
-
22
-
23
-
24
-
25
-
26
-
27
-
28
-
29
-
30
-
31
-
32
-
33
-
34
-
35
-
36
-
37
-
38
-
39
-
40
-
41
-
42
-
43
-
44
-
45
-
46
-
47
-
48
-
49
-
50
-
51
-
52
-
53
-
54
-
55
-
56
-
57
-
58
-
59
-
60
-
61
-
62
-
63
-
64
-
65
-
66
-
67
-
68
-
69
-
70
-
71
-
72
-
73
-
74
-
75
-
76
-
77
-
78
-
79
-
80
-
81
-
82
-
83
-
84
-
85
-
86
-
87
-
88
-
89
-
90
-
91
-
92
-
93
-
94
-
95
-
96
-
97
-
98
-
99
-
100
-
101
-
102
-
103
-
104
-
105
-
106
-
107
-
108
-
109
-
110
-
111
-
112
-
113
-
114
-
115
-
116
-
117
-
118
-
119
-
120
-
121
-
122
-
123
-
124
-
125
-
126
-
127
-
128
-
129
-
130
-
131
-
132
-
133
-
134
-
135
-
136
-
137
-
138
-
139
-
140
-
141
-
142
-
143
-
144
-
145
-
146
-
147
-
148
-
149
-
150
-
151
-
152
-
153
-
154
-
155
-
156
-
157
-
158
-
159
-
160
-
161
-
162
-
163
-
164
-
165
-
166
-
167
-
168
-
169
-
170
-
171
-
172
-
173
-
174
-
175
-
176
-
177
-
178
-
179
-
180
-
181
-
182
-
183
-
184
-
185
-
186
-
187
-
188
-
189
-
190
-
191
-
192
-
193
-
194
-
195
-
196
-
197
-
198
-
199
-
200
-
201
-
202
-
203
-
204
-
205
-
206
-
207
-
208
-
209
-
210
-
211
-
212
-
213
-
 214
214 -
 215
215 -
 216
216 -
 217
217 -
 218
218 -
 219
219 -
 220
220 -
 221
221 -
 222
222 -
 223
223 -
 224
224 -
 225
225 -
 226
226 -
 227
227 -
 228
228 -
 229
229 -
 230
230 -
 231
231 -
 232
232 -
 233
233 -
 234
234 -
235
-
236
-
237
-
238
-
239
-
240
-
241
-
242
-
243
-
244
-
245
-
246
-
247
-
248
-
249
-
250
-
251
-
252
 |
 |

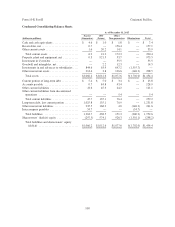
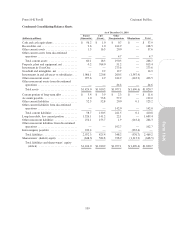
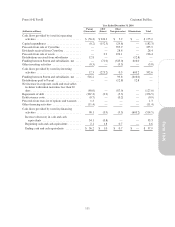
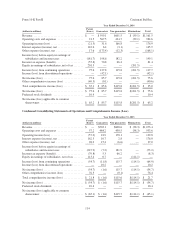
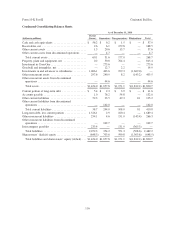
Form 10-K Part II Cincinnati Bell Inc.
Condensed Consolidating Balance Sheets
As of December 31, 2015
(dollars in millions)
Parent
(Guarantor)
CBT
(Issuer)
Other
Non-guarantors Eliminations Total
Cash and cash equivalents .................. $ 4.6 $ 1.0 $ 1.8 $ — $ 7.4
Receivables, net .......................... 0.7 — 156.4 — 157.1
Other current assets ....................... 1.6 20.2 14.1 — 35.9
Total current assets ..................... 6.9 21.2 172.3 — 200.4
Property, plant and equipment, net ........... 0.3 921.5 53.7 — 975.5
Investment in CyrusOne ................... — — 55.5 — 55.5
Goodwill and intangibles, net ............... — 2.2 12.3 — 14.5
Investments in and advances to subsidiaries .... 844.6 63.9 647.2 (1,555.7) —
Other noncurrent assets .................... 214.4 3.8 136.6 (146.3) 208.5
Total assets ........................... $1,066.2 $1,012.6 $1,077.6 $(1,702.0) $1,454.4
Current portion of long-term debt ............ $ 5.4 $ 5.0 $ 3.4 $ — $ 13.8
Accounts payable ........................ 0.7 84.8 43.4 — 128.9
Other current liabilities .................... 41.6 45.3 24.2 — 111.1
Other current liabilities from discontinued
operations ............................ — — 5.4 — 5.4
Total current liabilities .................. 47.7 135.1 76.4 — 259.2
Long-term debt, less current portion .......... 1,025.8 135.1 70.9 — 1,231.8
Other noncurrent liabilities ................. 235.5 168.3 4.0 (146.2) 261.6
Intercompany payables .................... 54.7 — — (54.7) —
Total liabilities ........................ 1,363.7 438.5 151.3 (200.9) 1,752.6
Shareowners’ (deficit) equity ............... (297.5) 574.1 926.3 (1,501.1) (298.2)
Total liabilities and shareowners’ equity
(deficit) ............................ $1,066.2 $1,012.6 $1,077.6 $(1,702.0) $1,454.4
108