Cincinnati Bell 2015 Annual Report Download - page 217
Download and view the complete annual report
Please find page 217 of the 2015 Cincinnati Bell annual report below. You can navigate through the pages in the report by either clicking on the pages listed below, or by using the keyword search tool below to find specific information within the annual report.-
 1
1 -
2
-
3
-
4
-
5
-
6
-
7
-
8
-
9
-
10
-
11
-
12
-
13
-
14
-
15
-
16
-
17
-
18
-
19
-
20
-
21
-
22
-
23
-
24
-
25
-
26
-
27
-
28
-
29
-
30
-
31
-
32
-
33
-
34
-
35
-
36
-
37
-
38
-
39
-
40
-
41
-
42
-
43
-
44
-
45
-
46
-
47
-
48
-
49
-
50
-
51
-
52
-
53
-
54
-
55
-
56
-
57
-
58
-
59
-
60
-
61
-
62
-
63
-
64
-
65
-
66
-
67
-
68
-
69
-
70
-
71
-
72
-
73
-
74
-
75
-
76
-
77
-
78
-
79
-
80
-
81
-
82
-
83
-
84
-
85
-
86
-
87
-
88
-
89
-
90
-
91
-
92
-
93
-
94
-
95
-
96
-
97
-
98
-
99
-
100
-
101
-
102
-
103
-
104
-
105
-
106
-
107
-
108
-
109
-
110
-
111
-
112
-
113
-
114
-
115
-
116
-
117
-
118
-
119
-
120
-
121
-
122
-
123
-
124
-
125
-
126
-
127
-
128
-
129
-
130
-
131
-
132
-
133
-
134
-
135
-
136
-
137
-
138
-
139
-
140
-
141
-
142
-
143
-
144
-
145
-
146
-
147
-
148
-
149
-
150
-
151
-
152
-
153
-
154
-
155
-
156
-
157
-
158
-
159
-
160
-
161
-
162
-
163
-
164
-
165
-
166
-
167
-
168
-
169
-
170
-
171
-
172
-
173
-
174
-
175
-
176
-
177
-
178
-
179
-
180
-
181
-
182
-
183
-
184
-
185
-
186
-
187
-
188
-
189
-
190
-
191
-
192
-
193
-
194
-
195
-
196
-
197
-
198
-
199
-
200
-
201
-
202
-
203
-
204
-
205
-
206
-
 207
207 -
 208
208 -
 209
209 -
 210
210 -
 211
211 -
 212
212 -
 213
213 -
 214
214 -
 215
215 -
 216
216 -
 217
217 -
 218
218 -
 219
219 -
 220
220 -
 221
221 -
 222
222 -
 223
223 -
 224
224 -
 225
225 -
 226
226 -
 227
227 -
228
-
229
-
230
-
231
-
232
-
233
-
234
-
235
-
236
-
237
-
238
-
239
-
240
-
241
-
242
-
243
-
244
-
245
-
246
-
247
-
248
-
249
-
250
-
251
-
252
 |
 |

Form 10-K Part II Cincinnati Bell Inc.
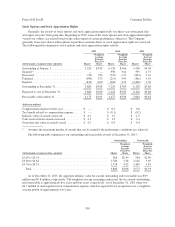
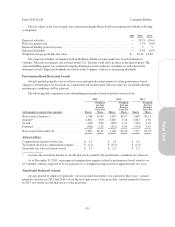
The fair values at the date of grant were estimated using the Black-Scholes pricing model with the following
assumptions:
2015 2014 2013
Expected volatility ......................................................... — 35.5% 43.6%
Risk-free interest rate ....................................................... — 1.5% 0.8%
Expected holding period (in years) ............................................. — 5 5
Expected dividends ......................................................... — 0.0% 0.0%
Weighted-average grant date fair value ......................................... $— $1.14 $1.84
The expected volatility assumption used in the Black-Scholes pricing model was based on historical
volatility. The risk-free interest rate is based on the U.S. Treasury yield curve in effect at the time of grant. The
expected holding period was estimated using the historical exercise behavior of employees and adjusted for
abnormal activity. Expected dividends are based on the Company’s history of not paying dividends.
Performance-Based Restricted Awards
Awards granted generally vest over three years and upon the achievement of certain performance-based
objectives. Performance-based awards are expensed based on their grant date fair value if it is probable that the
performance conditions will be achieved.
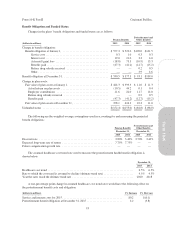
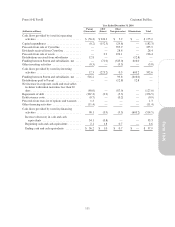
The following table summarizes our outstanding performance-based restricted award activity:
2015 2014 2013
(in thousands, except per share amounts) Shares
Weighted-
Average
Exercise
Price Per
Share Shares
Weighted-
Average
Exercise
Price Per
Share Shares
Weighted-
Average
Exercise
Price Per
Share
Non-vested at January 1, ..................... 1,746 $3.85 1,537 $3.97 1,687 $3.13
Granted* ................................. 2,692 3.09 1,085 3.56 1,067 4.56
Vested ................................... (445) 3.80 (635) 3.71 (703) 3.07
Forfeited .................................. (386) 3.28 (241) 3.65 (514) 3.67
Non-vested at December 31, .................. 3,607 $3.35 1,746 $3.85 1,537 $3.97
(dollars in millions)
Compensation expense for the year ............. $ 3.1 $ 1.4 $ 2.6
Tax benefit related to compensation expense ..... $ (1.1) $ (0.5) $ (1.0)
Grant date fair value of awards vested .......... $ 1.7 $ 2.3 $ 2.2
* Assumes the maximum number of awards that can be earned if the performance conditions are achieved.
As of December 31, 2015, unrecognized compensation expense related to performance-based awards was
$7.5 million, which is expected to be recognized over a weighted-average period of approximately two years.
Time-Based Restricted Awards
Awards granted to employees generally vest in one-third increments over a period of three years. Awards
granted to directors in 2015 and 2014 vest on the first anniversary of the grant date. Awards granted to directors
in 2013 vest on the second anniversary of the grant date.
101
Form 10-K