Cincinnati Bell 2015 Annual Report Download - page 220
Download and view the complete annual report
Please find page 220 of the 2015 Cincinnati Bell annual report below. You can navigate through the pages in the report by either clicking on the pages listed below, or by using the keyword search tool below to find specific information within the annual report.-
 1
1 -
2
-
3
-
4
-
5
-
6
-
7
-
8
-
9
-
10
-
11
-
12
-
13
-
14
-
15
-
16
-
17
-
18
-
19
-
20
-
21
-
22
-
23
-
24
-
25
-
26
-
27
-
28
-
29
-
30
-
31
-
32
-
33
-
34
-
35
-
36
-
37
-
38
-
39
-
40
-
41
-
42
-
43
-
44
-
45
-
46
-
47
-
48
-
49
-
50
-
51
-
52
-
53
-
54
-
55
-
56
-
57
-
58
-
59
-
60
-
61
-
62
-
63
-
64
-
65
-
66
-
67
-
68
-
69
-
70
-
71
-
72
-
73
-
74
-
75
-
76
-
77
-
78
-
79
-
80
-
81
-
82
-
83
-
84
-
85
-
86
-
87
-
88
-
89
-
90
-
91
-
92
-
93
-
94
-
95
-
96
-
97
-
98
-
99
-
100
-
101
-
102
-
103
-
104
-
105
-
106
-
107
-
108
-
109
-
110
-
111
-
112
-
113
-
114
-
115
-
116
-
117
-
118
-
119
-
120
-
121
-
122
-
123
-
124
-
125
-
126
-
127
-
128
-
129
-
130
-
131
-
132
-
133
-
134
-
135
-
136
-
137
-
138
-
139
-
140
-
141
-
142
-
143
-
144
-
145
-
146
-
147
-
148
-
149
-
150
-
151
-
152
-
153
-
154
-
155
-
156
-
157
-
158
-
159
-
160
-
161
-
162
-
163
-
164
-
165
-
166
-
167
-
168
-
169
-
170
-
171
-
172
-
173
-
174
-
175
-
176
-
177
-
178
-
179
-
180
-
181
-
182
-
183
-
184
-
185
-
186
-
187
-
188
-
189
-
190
-
191
-
192
-
193
-
194
-
195
-
196
-
197
-
198
-
199
-
200
-
201
-
202
-
203
-
204
-
205
-
206
-
207
-
208
-
209
-
 210
210 -
 211
211 -
 212
212 -
 213
213 -
 214
214 -
 215
215 -
 216
216 -
 217
217 -
 218
218 -
 219
219 -
 220
220 -
 221
221 -
 222
222 -
 223
223 -
 224
224 -
 225
225 -
 226
226 -
 227
227 -
 228
228 -
 229
229 -
 230
230 -
231
-
232
-
233
-
234
-
235
-
236
-
237
-
238
-
239
-
240
-
241
-
242
-
243
-
244
-
245
-
246
-
247
-
248
-
249
-
250
-
251
-
252
 |
 |

Form 10-K Part II Cincinnati Bell Inc.
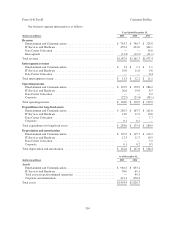
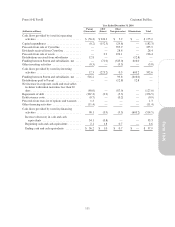
Our business segment information is as follows:
Year Ended December 31,
(dollars in millions) 2015 2014 2013
Revenue
Entertainment and Communications ................................. $ 743.7 $ 740.7 $ 724.8
IT Services and Hardware ......................................... 435.4 433.0 344.1
Data Center Colocation ........................................... — — 15.6
Intersegment ................................................... (11.3) (12.2) (11.1)
Total revenue ..................................................... $1,167.8 $1,161.5 $1,073.4
Intersegment revenue
Entertainment and Communications ................................. $ 1.3 $ 1.2 $ 1.1
IT Services and Hardware ......................................... 10.0 11.0 9.6
Data Center Colocation ........................................... — — 0.4
Total intersegment revenue .......................................... $ 11.3 $ 12.2 $ 11.1
Operating income
Entertainment and Communications ................................. $ 129.9 $ 178.9 $ 186.2
IT Services and Hardware ......................................... 20.6 19.8 8.5
Data Center Colocation ........................................... — — 3.2
Corporate ...................................................... (22.5) (21.8) (58.1)
Total operating income ............................................. $ 128.0 $ 176.9 $ 139.8
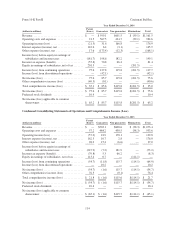
Expenditures for long-lived assets
Entertainment and Communications ................................. $ 269.5 $ 163.7 $ 162.6
IT Services and Hardware ......................................... 14.0 11.9 10.6
Data Center Colocation ........................................... — — 7.7
Corporate ...................................................... 0.1 0.2 —
Total expenditures for long-lived assets ................................ $ 283.6 $ 175.8 $ 180.9
Depreciation and amortization
Entertainment and Communications ................................. $ 129.2 $ 115.7 $ 112.2
IT Services and Hardware ......................................... 12.3 11.7 10.5
Data Center Colocation ........................................... — — 5.2
Corporate ...................................................... 0.1 0.2 0.5
Total depreciation and amortization ................................... $ 141.6 $ 127.6 $ 128.4
As of December 31,
(dollars in millions) 2015 2014
Assets
Entertainment and Communications ................................. $ 983.3 $ 833.2
IT Services and Hardware ......................................... 58.0 61.4
Total assets from discontinued operations ............................ — 49.3
Corporate and eliminations ........................................ 413.1 876.8
Total assets ...................................................... $1,454.4 $1,820.7
104