Cincinnati Bell 2015 Annual Report Download - page 187
Download and view the complete annual report
Please find page 187 of the 2015 Cincinnati Bell annual report below. You can navigate through the pages in the report by either clicking on the pages listed below, or by using the keyword search tool below to find specific information within the annual report.-
 1
1 -
2
-
3
-
4
-
5
-
6
-
7
-
8
-
9
-
10
-
11
-
12
-
13
-
14
-
15
-
16
-
17
-
18
-
19
-
20
-
21
-
22
-
23
-
24
-
25
-
26
-
27
-
28
-
29
-
30
-
31
-
32
-
33
-
34
-
35
-
36
-
37
-
38
-
39
-
40
-
41
-
42
-
43
-
44
-
45
-
46
-
47
-
48
-
49
-
50
-
51
-
52
-
53
-
54
-
55
-
56
-
57
-
58
-
59
-
60
-
61
-
62
-
63
-
64
-
65
-
66
-
67
-
68
-
69
-
70
-
71
-
72
-
73
-
74
-
75
-
76
-
77
-
78
-
79
-
80
-
81
-
82
-
83
-
84
-
85
-
86
-
87
-
88
-
89
-
90
-
91
-
92
-
93
-
94
-
95
-
96
-
97
-
98
-
99
-
100
-
101
-
102
-
103
-
104
-
105
-
106
-
107
-
108
-
109
-
110
-
111
-
112
-
113
-
114
-
115
-
116
-
117
-
118
-
119
-
120
-
121
-
122
-
123
-
124
-
125
-
126
-
127
-
128
-
129
-
130
-
131
-
132
-
133
-
134
-
135
-
136
-
137
-
138
-
139
-
140
-
141
-
142
-
143
-
144
-
145
-
146
-
147
-
148
-
149
-
150
-
151
-
152
-
153
-
154
-
155
-
156
-
157
-
158
-
159
-
160
-
161
-
162
-
163
-
164
-
165
-
166
-
167
-
168
-
169
-
170
-
171
-
172
-
173
-
174
-
175
-
176
-
 177
177 -
 178
178 -
 179
179 -
 180
180 -
 181
181 -
 182
182 -
 183
183 -
 184
184 -
 185
185 -
 186
186 -
 187
187 -
 188
188 -
 189
189 -
 190
190 -
 191
191 -
 192
192 -
 193
193 -
 194
194 -
 195
195 -
 196
196 -
 197
197 -
198
-
199
-
200
-
201
-
202
-
203
-
204
-
205
-
206
-
207
-
208
-
209
-
210
-
211
-
212
-
213
-
214
-
215
-
216
-
217
-
218
-
219
-
220
-
221
-
222
-
223
-
224
-
225
-
226
-
227
-
228
-
229
-
230
-
231
-
232
-
233
-
234
-
235
-
236
-
237
-
238
-
239
-
240
-
241
-
242
-
243
-
244
-
245
-
246
-
247
-
248
-
249
-
250
-
251
-
252
 |
 |

Form 10-K Part II Cincinnati Bell Inc.
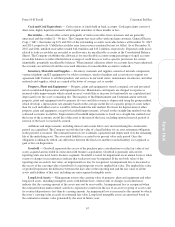
employee who is retirement eligible, the compensation cost is recognized over the service period up to the date
that the employee first becomes eligible to retire.
Pension and Postretirement Benefit Plans — The Company maintains qualified and non-qualified defined
benefit pension plans, and also provides postretirement healthcare and life insurance benefits for eligible
employees. We recognize the overfunded or underfunded status of the defined benefit pension and other
postretirement benefit plans as either an asset or liability. Changes in the funded status of these plans are
recognized as a component of comprehensive income (loss) in the year they occur. Pension and postretirement
healthcare and life insurance benefits earned during the year and interest on the projected benefit obligations are
accrued and recognized currently in net periodic benefit cost. Prior service costs and credits are amortized over
the average life expectancy of participants or remaining service period, based upon whether plan participants are
mostly retirees or active employees. Net gains or losses resulting from differences between actuarial experience
and assumptions or from changes in actuarial assumptions are recognized as a component of annual net periodic
benefit cost. Unrecognized actuarial gains or losses that exceed 10% of the projected benefit obligation are
amortized on a straight-line basis over the average remaining service life of active employees for the pension and
bargained postretirement plans (approximately 9-13 years) and average life expectancy of retirees for the
management postretirement plan (approximately 17 years).
Business Combinations — In accounting for business combinations, we apply the accounting requirements
of ASC 805, “Business Combinations,” which requires the recording of net assets of acquired businesses at fair
value. In developing estimates of fair value of acquired assets and assumed liabilities, management analyzes a
variety of factors including market data, estimated future cash flows of the acquired operations, industry growth
rates, current replacement cost for fixed assets, and market rate assumptions for contractual obligations. Such a
valuation requires management to make significant estimates and assumptions, particularly with respect to the
intangible assets. In addition, contingent consideration is presented at fair value at the date of acquisition.
Transaction costs are expensed as incurred.
Fair Value Measurements — Fair value of financial and non-financial assets and liabilities is defined as
the price representing the amount that would be received to sell an asset or paid to transfer a liability in an
orderly transaction between market participants. Fair value is utilized to measure certain investments on a
recurring basis. Fair value measurements are also utilized to determine the initial value of assets and liabilities
acquired in a business combination, to perform impairment tests, and for disclosure purposes.
Management uses quoted market prices and observable inputs to the maximum extent possible when
measuring fair value. In the absence of quoted market prices or observable inputs, fair value is determined using
valuation models that incorporate assumptions that a market participant would use in pricing the asset or liability.
Fair value measurements are classified within one of three levels, which prioritize the inputs used in the
methodologies of measuring fair value for assets and liabilities, as follows:
Level 1 — Quoted market prices for identical instruments in an active market;
Level 2 — Quoted prices for similar assets and liabilities in active markets, quoted prices for identical or
similar assets or liabilities in markets that are not active, inputs other than quoted prices that are observable
for the asset or liability (i.e., interest rates, yield curves, etc.), and inputs that are derived principally from or
corroborated by observable market data by correlation or other means (market corroborated inputs); and
Level 3 — Unobservable inputs that reflect management’s determination of assumptions that market
participants would use in pricing the asset or liability. These inputs are developed based on the best
information available, including our own data.
Foreign Currency Translation and Transactions — The financial position of foreign subsidiaries is
translated at the exchange rates in effect at the end of the period, while revenues and expenses are translated at
average rates of exchange during the period. Gains or losses from translation of foreign operations where the
local currency is the functional currency are included as components of accumulated other comprehensive
income (loss). Gains and losses arising from foreign currency transactions are recorded in other income
(expense) in the period incurred.
71
Form 10-K