Cincinnati Bell 2015 Annual Report Download - page 153
Download and view the complete annual report
Please find page 153 of the 2015 Cincinnati Bell annual report below. You can navigate through the pages in the report by either clicking on the pages listed below, or by using the keyword search tool below to find specific information within the annual report.-
 1
1 -
2
-
3
-
4
-
5
-
6
-
7
-
8
-
9
-
10
-
11
-
12
-
13
-
14
-
15
-
16
-
17
-
18
-
19
-
20
-
21
-
22
-
23
-
24
-
25
-
26
-
27
-
28
-
29
-
30
-
31
-
32
-
33
-
34
-
35
-
36
-
37
-
38
-
39
-
40
-
41
-
42
-
43
-
44
-
45
-
46
-
47
-
48
-
49
-
50
-
51
-
52
-
53
-
54
-
55
-
56
-
57
-
58
-
59
-
60
-
61
-
62
-
63
-
64
-
65
-
66
-
67
-
68
-
69
-
70
-
71
-
72
-
73
-
74
-
75
-
76
-
77
-
78
-
79
-
80
-
81
-
82
-
83
-
84
-
85
-
86
-
87
-
88
-
89
-
90
-
91
-
92
-
93
-
94
-
95
-
96
-
97
-
98
-
99
-
100
-
101
-
102
-
103
-
104
-
105
-
106
-
107
-
108
-
109
-
110
-
111
-
112
-
113
-
114
-
115
-
116
-
117
-
118
-
119
-
120
-
121
-
122
-
123
-
124
-
125
-
126
-
127
-
128
-
129
-
130
-
131
-
132
-
133
-
134
-
135
-
136
-
137
-
138
-
139
-
140
-
141
-
142
-
 143
143 -
 144
144 -
 145
145 -
 146
146 -
 147
147 -
 148
148 -
 149
149 -
 150
150 -
 151
151 -
 152
152 -
 153
153 -
 154
154 -
 155
155 -
 156
156 -
 157
157 -
 158
158 -
 159
159 -
 160
160 -
 161
161 -
 162
162 -
 163
163 -
164
-
165
-
166
-
167
-
168
-
169
-
170
-
171
-
172
-
173
-
174
-
175
-
176
-
177
-
178
-
179
-
180
-
181
-
182
-
183
-
184
-
185
-
186
-
187
-
188
-
189
-
190
-
191
-
192
-
193
-
194
-
195
-
196
-
197
-
198
-
199
-
200
-
201
-
202
-
203
-
204
-
205
-
206
-
207
-
208
-
209
-
210
-
211
-
212
-
213
-
214
-
215
-
216
-
217
-
218
-
219
-
220
-
221
-
222
-
223
-
224
-
225
-
226
-
227
-
228
-
229
-
230
-
231
-
232
-
233
-
234
-
235
-
236
-
237
-
238
-
239
-
240
-
241
-
242
-
243
-
244
-
245
-
246
-
247
-
248
-
249
-
250
-
251
-
252
 |
 |

Form 10-K Part II Cincinnati Bell Inc.
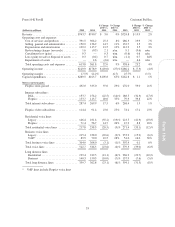
IT Services and Hardware
The IT Services and Hardware segment provides a full range of managed IT solutions, including managed
infrastructure services, telephony and IT equipment sales, and professional IT staffing services. These services
and products are provided through the Company’s subsidiaries in various geographic areas throughout the United
States, Canada and United Kingdom. By offering a full range of equipment and outsourced services in
conjunction with the Company’s fiber and copper networks, the IT Services and Hardware segment provides
end-to-end IT and telecommunications infrastructure management designed to reduce cost and mitigate risk
while optimizing performance for its customers.
(dollars in millions) 2015 2014
$ Change
2015 vs.
2014
% Change
2015 vs.
2014 2013
$ Change
2014 vs.
2013
% Change
2014 vs.
2013
Revenue .......................... $435.4 $433.0 $ 2.4 1% $344.1 $88.9 26%
Operating costs and expenses:
Cost of services and products ....... 345.2 350.0 (4.8) (1)% 279.8 70.2 25%
Selling, general and administrative . . . 54.0 51.5 2.5 5% 44.6 6.9 15%
Depreciation and amortization ...... 12.3 11.7 0.6 5% 10.5 1.2 11%
Restructuring charges ............. 2.8 — 2.8 n/m 0.7 (0.7) n/m
Loss on sale or disposal of assets .... 0.5 — 0.5 n/m — — n/m
Total operating costs and expenses . . . 414.8 413.2 1.6 0% 335.6 77.6 23%
Operating income .................. $ 20.6 $ 19.8 $ 0.8 4% $ 8.5 $11.3 n/m
Operating margin ................... 4.7% 4.6% 0.1 pts 2.5% 2.1 pts
Capital expenditures ................ $ 14.0 $ 11.9 $ 2.1 18% $ 10.6 $ 1.3 12%
Revenue
The following IT services and hardware products have either been classified as strategic or integration:
Year ended December 31,
(dollars in millions) 2015 2014 2013
Strategic business revenue
Professional services ................................................. $ 90.4 $ 70.2 $ 63.9
Management and monitoring ........................................... 31.0 24.8 19.2
Unified communications .............................................. 27.1 22.9 18.6
Cloud services ...................................................... 30.9 20.8 16.4
Total strategic business revenue ........................................... 179.4 138.7 118.1
Integration business revenue
Professional services ................................................. 15.1 16.4 11.7
Management and monitoring ........................................... — 0.4 0.4
Unified communications .............................................. 10.7 12.2 13.0
Telecom and IT hardware ............................................. 230.2 265.3 200.9
Total integration business revenue ......................................... 256.0 294.3 226.0
Total IT Services and Hardware revenue .................................... $435.4 $433.0 $344.1
We continue to generate revenue growth across all of our strategic products. During 2015 and 2014, our
professional services group increased billable headcount and utilization with our existing customer base. In 2013,
our professional service group began designing an infrastructure that enables secure, efficient access to data,
internet, and shared and cloud applications of our customers’ intellectual property. This new service generated an
37
Form 10-K