Cincinnati Bell 2015 Annual Report Download - page 41
Download and view the complete annual report
Please find page 41 of the 2015 Cincinnati Bell annual report below. You can navigate through the pages in the report by either clicking on the pages listed below, or by using the keyword search tool below to find specific information within the annual report.-
 1
1 -
2
-
3
-
4
-
5
-
6
-
7
-
8
-
9
-
10
-
11
-
12
-
13
-
14
-
15
-
16
-
17
-
18
-
19
-
20
-
21
-
22
-
23
-
24
-
25
-
26
-
27
-
28
-
29
-
30
-
 31
31 -
 32
32 -
 33
33 -
 34
34 -
 35
35 -
 36
36 -
 37
37 -
 38
38 -
 39
39 -
 40
40 -
 41
41 -
 42
42 -
 43
43 -
 44
44 -
 45
45 -
 46
46 -
 47
47 -
 48
48 -
 49
49 -
 50
50 -
 51
51 -
52
-
53
-
54
-
55
-
56
-
57
-
58
-
59
-
60
-
61
-
62
-
63
-
64
-
65
-
66
-
67
-
68
-
69
-
70
-
71
-
72
-
73
-
74
-
75
-
76
-
77
-
78
-
79
-
80
-
81
-
82
-
83
-
84
-
85
-
86
-
87
-
88
-
89
-
90
-
91
-
92
-
93
-
94
-
95
-
96
-
97
-
98
-
99
-
100
-
101
-
102
-
103
-
104
-
105
-
106
-
107
-
108
-
109
-
110
-
111
-
112
-
113
-
114
-
115
-
116
-
117
-
118
-
119
-
120
-
121
-
122
-
123
-
124
-
125
-
126
-
127
-
128
-
129
-
130
-
131
-
132
-
133
-
134
-
135
-
136
-
137
-
138
-
139
-
140
-
141
-
142
-
143
-
144
-
145
-
146
-
147
-
148
-
149
-
150
-
151
-
152
-
153
-
154
-
155
-
156
-
157
-
158
-
159
-
160
-
161
-
162
-
163
-
164
-
165
-
166
-
167
-
168
-
169
-
170
-
171
-
172
-
173
-
174
-
175
-
176
-
177
-
178
-
179
-
180
-
181
-
182
-
183
-
184
-
185
-
186
-
187
-
188
-
189
-
190
-
191
-
192
-
193
-
194
-
195
-
196
-
197
-
198
-
199
-
200
-
201
-
202
-
203
-
204
-
205
-
206
-
207
-
208
-
209
-
210
-
211
-
212
-
213
-
214
-
215
-
216
-
217
-
218
-
219
-
220
-
221
-
222
-
223
-
224
-
225
-
226
-
227
-
228
-
229
-
230
-
231
-
232
-
233
-
234
-
235
-
236
-
237
-
238
-
239
-
240
-
241
-
242
-
243
-
244
-
245
-
246
-
247
-
248
-
249
-
250
-
251
-
252
 |
 |

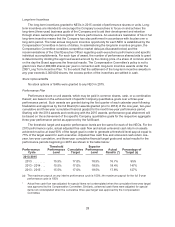
The 2015 target annual incentives for each of the NEOs at year-end are set forth below:
Named Executive Officer
Target Annual Incentive
as a Percentage of Base Salary
Theodore H. Torbeck ............ 100%
Leigh R. Fox ................... 100%
Thomas E. Simpson ............. 70%
Christopher J. Wilson ............ 100%
Joshua T. Duckworth ............ 50%
In 2015, for annual incentive purposes, the chart below sets out the Adjusted EBITDA and
revenue target goals and actual results, which produced a weighted-average payout for the financial
portion of approximately 103% of target:
Financial Objective
2015
Threshold
Performance
Level
2015 Adjusted
Target
2015
Superior
Performance
Level
2015 Actual
Results
Adjusted EBITDA ..... 95% $300M 120% $302 M
Revenue ............ 95% $1.14 B 120% $1.17 B
The Chief Executive Officer provides the Compensation Committee with his assessment of each
other executive officer’s individual performance. The Chief Executive Officer reviews, for each
executive officer, the performance of the executive’s department, the quality of the executive’s advice
and counsel on matters within the executive’s purview, qualitative peer feedback and the effectiveness
of the executive’s communication with the organization and with the Chief Executive Officer on matters
of topical concern. These factors are evaluated subjectively and are not assigned specific individual
weight. The Chief Executive Officer then recommends an award for the individual performance-based
portion for each of the other NEO’s annual incentive, which can range from 0% to 200% of the target
award for such portion.
The Compensation Committee meets in executive session to consider the Chief Executive
Officer’s individual performance. The Compensation Committee evaluates the information obtained
from the other directors concerning the Chief Executive Officer’s individual performance, based on a
discussion led by the Chairman of the Board. Factors considered include: operational and financial
performance, succession planning, development of the Company leadership team, development of
business opportunities and community involvement/relationships. The Compensation Committee has
discretion in evaluating the Chief Executive Officer’s performance and may recommend to the full
Board a discretionary increase or decrease to the Chief Executive Officer’s final incentive award as the
Compensation Committee believes is warranted.
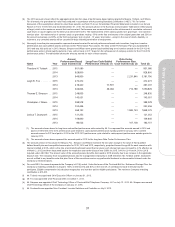
The table below shows the percentage of target annual incentive earned by each NEO for 2015 for
each performance measure and in total as well as the actual award payment:
Named Executive Officer
Total
Company
Revenue
Total
Company
Adjusted
EBITDA
Individual
Performance
Total Annual
Incentive Award
Total Annual
Incentive Award
Payment
Theodore H. Torbeck . . . 103% 103% 200% 123% $951,080
Leigh R. Fox .......... 103% 103% 200% 123% $472,472
Thomas E. Simpson (a) . .
103% 103% 200% 123% $248,835
Christopher J. Wilson . . . 103% 103% 150% 113% $398,578
Joshua T. Duckworth . . . 103% 103% 175% 118% $121,252
(a) Mr. Simpson’s award reflects the prorated payout based on his incentive targets in 2015.
27
Proxy Statement