Cincinnati Bell 2015 Annual Report Download - page 125
Download and view the complete annual report
Please find page 125 of the 2015 Cincinnati Bell annual report below. You can navigate through the pages in the report by either clicking on the pages listed below, or by using the keyword search tool below to find specific information within the annual report.-
 1
1 -
2
-
3
-
4
-
5
-
6
-
7
-
8
-
9
-
10
-
11
-
12
-
13
-
14
-
15
-
16
-
17
-
18
-
19
-
20
-
21
-
22
-
23
-
24
-
25
-
26
-
27
-
28
-
29
-
30
-
31
-
32
-
33
-
34
-
35
-
36
-
37
-
38
-
39
-
40
-
41
-
42
-
43
-
44
-
45
-
46
-
47
-
48
-
49
-
50
-
51
-
52
-
53
-
54
-
55
-
56
-
57
-
58
-
59
-
60
-
61
-
62
-
63
-
64
-
65
-
66
-
67
-
68
-
69
-
70
-
71
-
72
-
73
-
74
-
75
-
76
-
77
-
78
-
79
-
80
-
81
-
82
-
83
-
84
-
85
-
86
-
87
-
88
-
89
-
90
-
91
-
92
-
93
-
94
-
95
-
96
-
97
-
98
-
99
-
100
-
101
-
102
-
103
-
104
-
105
-
106
-
107
-
108
-
109
-
110
-
111
-
112
-
113
-
114
-
 115
115 -
 116
116 -
 117
117 -
 118
118 -
 119
119 -
 120
120 -
 121
121 -
 122
122 -
 123
123 -
 124
124 -
 125
125 -
 126
126 -
 127
127 -
 128
128 -
 129
129 -
 130
130 -
 131
131 -
 132
132 -
 133
133 -
 134
134 -
 135
135 -
136
-
137
-
138
-
139
-
140
-
141
-
142
-
143
-
144
-
145
-
146
-
147
-
148
-
149
-
150
-
151
-
152
-
153
-
154
-
155
-
156
-
157
-
158
-
159
-
160
-
161
-
162
-
163
-
164
-
165
-
166
-
167
-
168
-
169
-
170
-
171
-
172
-
173
-
174
-
175
-
176
-
177
-
178
-
179
-
180
-
181
-
182
-
183
-
184
-
185
-
186
-
187
-
188
-
189
-
190
-
191
-
192
-
193
-
194
-
195
-
196
-
197
-
198
-
199
-
200
-
201
-
202
-
203
-
204
-
205
-
206
-
207
-
208
-
209
-
210
-
211
-
212
-
213
-
214
-
215
-
216
-
217
-
218
-
219
-
220
-
221
-
222
-
223
-
224
-
225
-
226
-
227
-
228
-
229
-
230
-
231
-
232
-
233
-
234
-
235
-
236
-
237
-
238
-
239
-
240
-
241
-
242
-
243
-
244
-
245
-
246
-
247
-
248
-
249
-
250
-
251
-
252
 |
 |

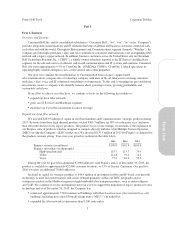
Form 10-K Part I Cincinnati Bell Inc.
Competition
The telecommunications industry is very competitive and the Company competes against larger, well-
capitalized national providers.
The Entertainment and Communications segment faces competition from other local exchange carriers,
wireless service providers, inter-exchange carriers, as well as cable, broadband, and internet service providers.
The Company has lost, and will likely continue to lose, access lines as a part of its customer base utilizes the
services of competitive wireline or wireless providers in lieu of the Company’s services. Wireless providers,
particularly those that provide unlimited wireless service plans with no additional fees for long distance, offer
customers a substitution service for the Company’s local voice and long-distance services. The Company
believes wireless substitution is the reason for the largest portion of the Company’s access line and long-distance
line losses.
Our strategic products also face intense competition from cable operators, other telecom companies and
niche fiber companies. Many of our competitors have lower operating costs and access to resources that provide
economies of scale allowing them to more aggressively price products which they are able to provide on a much
broader scale given their expanded geographic operations. Our competitors are expected to continuously upgrade
their service quality and offerings which could substantially erode the competitive advantage we currently have
with our fiber-based products. These competitive factors could limit the Company’s ability to grow revenue and
cash flows despite the strategic initiatives implemented.
The Fioptics suite of products also face competition from a number of different sources, including
companies that deliver movies, television shows and other video programming over broadband Internet
connections. Increasingly, content owners are utilizing Internet-based delivery of content directly to consumers,
some without charging a fee for access to the content. Furthermore, due to consumer electronics innovations,
consumers are able to watch such Internet-delivered content on television sets and mobile devices. Increased
customer migration to these non-traditional entertainment products could result in increased Fioptics churn and
decreased penetration.
The IT Services and Hardware segment competes against numerous other information technology
consulting, web-hosting, and computer system integration companies, many of which are larger in scope and
well-financed. The Company believes that participants in this market must grow rapidly and achieve significant
scale to compete effectively. Other competitors may consolidate with larger companies or acquire software
application vendors or technology providers, enabling them to more effectively compete. This consolidation
could affect prices and other competitive factors in ways that could impede the ability of these businesses to
compete successfully in the market.
Customers
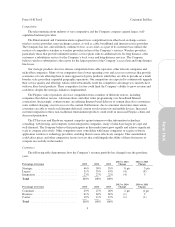
The following table demonstrates how the Company’s revenue portfolio has changed over the past three
years.
Percentage of revenue 2015 2014 2013
2015 vs 2014
Change
2014 vs 2013
Change
Strategic ............................... 46% 38% 35% 8pts 3pts
Legacy ................................ 31% 35% 43% (4) (8)
Integration ............................. 23% 27% 22% (4) 5
Total ................................. 100% 100% 100%
Percentage of revenue 2015 2014 2013
2015 vs 2014
Change
2014 vs 2013
Change
Consumer .............................. 29% 27% 28% 2pts (1)pt
Business ............................... 61% 62% 60% (1) 2
Carrier ................................ 10% 11% 12% (1) (1)
Total ................................. 100% 100% 100%
9
Form 10-K